| Date | Price $ | Result % | Candle Name | Side |
|---|---|---|---|---|
| 001 28 Mar 2024 | Sell Price: 145.51 | Profit: Open Day2 ($ 144.02) | Engulfing | Sell |
| 002 22 Mar 2024 | Sell Price: 147.45 | Profit: Close Day1 ($ 145.56) | Engulfing | Sell |
| 003 27 Feb 2024 | Buy Price: 132.55 | Profit: Open Day1 ($ 139.88) | Engulfing | Buy |
| 004 18 Jan 2024 | Buy Price: 130.46 | Profit: Close Day1 ($ 131.22) | Engulfing | Buy |
| 005 07 Dec 2023 | Sell Price: 128.68 | Profit: Open Day1 ($ 128.09) | Dark Cloud Cover | Sell |
| 006 20 Oct 2023 | Sell Price: 109.23 | Profit: Open Day1 ($ 108.10) | Engulfing | Sell |
| 007 12 Oct 2023 | Sell Price: 108.94 | Profit: Open Day1 ($ 108.02) | Abandoned Baby | Sell |
| 008 20 Sep 2023 | Buy Price: 112.47 | Loss: Close Day2 ($ 111.44) | Abandoned Baby | Buy |
| 009 13 Sep 2023 | Buy Price: 113.43 | Profit: Open Day1 ($ 113.79) | Engulfing | Buy |
| 010 13 Sep 2023 | Buy Price: 113.37 | Profit: Open Day1 ($ 113.79) | Piercing Line | Buy |
| 011 31 Aug 2023 | Sell Price: 121.07 | Profit: Close Day2 ($ 118.73) | Engulfing | Sell |
| 012 21 Jun 2023 | Buy Price: 118.33 | Profit: Open Day1 ($ 118.84) | Piercing Line | Buy |
| 013 02 May 2023 | Sell Price: 134.52 | Profit: Close Day2 ($ 133.88) | Abandoned Baby | Sell |
| 014 26 Apr 2023 | Buy Price: 133.12 | Profit: Close Day1 ($ 133.25) | Piercing Line | Buy |
| 015One Year Average | Both Sides Result for 14 Signals |
Profit: $ 17.48 ($ 1.25 / Signal) |
All of Them | Buy + Sell |
| Simple Moving Averages (SMA) Period | Value $ | Signal | Exponential Moving Averages (EMA) Period | Value $ | Signal | |
|---|---|---|---|---|---|---|
| 2 | 132.59 | BUY | 2 | 133.00 | SELL | |
| 3 | 133.24 | SELL | 3 | 133.69 | SELL | |
| 5 | 135.35 | SELL | 5 | 135.25 | SELL | |
| 8 | 138.33 | SELL | 8 | 137.15 | SELL | |
| 13 | 140.59 | SELL | 13 | 139.19 | SELL | |
| 21 | 142.69 | SELL | 21 | 140.71 | SELL | |
| 34 | 144.22 | SELL | 34 | 141.01 | SELL | |
| 55 | 140.24 | SELL | 55 | 139.67 | SELL | |
| 90 | 137.68 | SELL | 90 | 136.68 | SELL | |
| 200 | 126.39 | BUY | 200 | 131.97 | BUY |
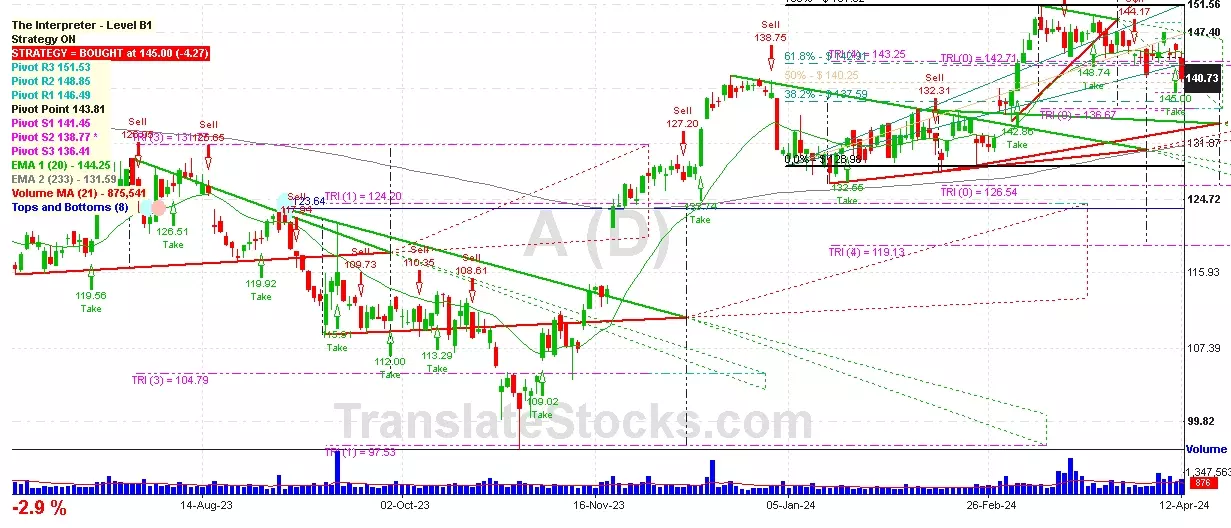
Agilent Technologies Inc
IPO: 1999-11-18
Ticker: AIndices: S&P 500,
Exchange: New York Stock Exchange, Inc. (US - USD)
Website: https://www.agilent.com/
Phone:
Common Stock
Life Sciences (
Laboratory Analytical Instruments

 Click to Enlarge