| Date | Price $ | Result % | Candle Name | Side |
|---|---|---|---|---|
| 001 03 Apr 2024 | Buy Price: 84.16 | Profit: Open Day1 ($ 84.85) | Piercing Line | Buy |
| 002 15 Mar 2024 | Buy Price: 81.77 | Profit: Open Day1 ($ 82.07) | Engulfing | Buy |
| 003 23 Feb 2024 | Buy Price: 61.10 | Profit: Open Day2 ($ 62.03) | Engulfing | Buy |
| 004 02 Jan 2024 | Buy Price: 61.95 | Loss: Close Day2 ($ 60.51) | Engulfing | Buy |
| 005 14 Nov 2023 | Buy Price: 58.40 | Loss: Close Day2 ($ 53.44) | Abandoned Baby | Buy |
| 006 01 Nov 2023 | Sell Price: 51.55 | Loss: Close Day2 ($ 57.14) | Dark Cloud Cover | Sell |
| 007 11 Oct 2023 | Sell Price: 51.26 | Profit: Open Day1 ($ 51.10) | Engulfing | Sell |
| 008 05 Oct 2023 | Buy Price: 52.96 | Loss: Close Day2 ($ 51.36) | Piercing Line | Buy |
| 009 28 Sep 2023 | Buy Price: 55.07 | Profit: Open Day1 ($ 55.94) | Engulfing | Buy |
| 010 28 Sep 2023 | Buy Price: 55.05 | Profit: Open Day1 ($ 55.94) | Piercing Line | Buy |
| 011 19 Sep 2023 | Buy Price: 59.66 | Profit: Open Day1 ($ 60.11) | Engulfing | Buy |
| 012 18 Aug 2023 | Buy Price: 69.83 | Loss: Close Day2 ($ 67.36) | Piercing Line | Buy |
| 013 13 Jul 2023 | Sell Price: 70.66 | Profit: Open Day1 ($ 70.59) | Abandoned Baby | Sell |
| 014 11 May 2023 | Sell Price: 124.17 | Profit: Close Day1 ($ 122.86) | Abandoned Baby | Sell |
| 015One Year Average | Both Sides Result for 14 Signals |
Loss: $ -10.40 ($ -0.74 / Signal) |
All of Them | Buy + Sell |
| Simple Moving Averages (SMA) Period | Value $ | Signal | Exponential Moving Averages (EMA) Period | Value $ | Signal | |
|---|---|---|---|---|---|---|
| 2 | 75.61 | BUY | 2 | 75.82 | BUY | |
| 3 | 74.28 | BUY | 3 | 75.01 | BUY | |
| 5 | 72.68 | BUY | 5 | 74.54 | BUY | |
| 8 | 74.27 | BUY | 8 | 75.02 | BUY | |
| 13 | 76.69 | BUY | 13 | 76.17 | BUY | |
| 21 | 79.92 | SELL | 21 | 76.89 | BUY | |
| 34 | 78.59 | SELL | 34 | 76.16 | BUY | |
| 55 | 73.25 | BUY | 55 | 73.87 | BUY | |
| 90 | 68.87 | BUY | 90 | 71.11 | BUY | |
| 200 | 64.46 | BUY | 200 | 75.55 | BUY |
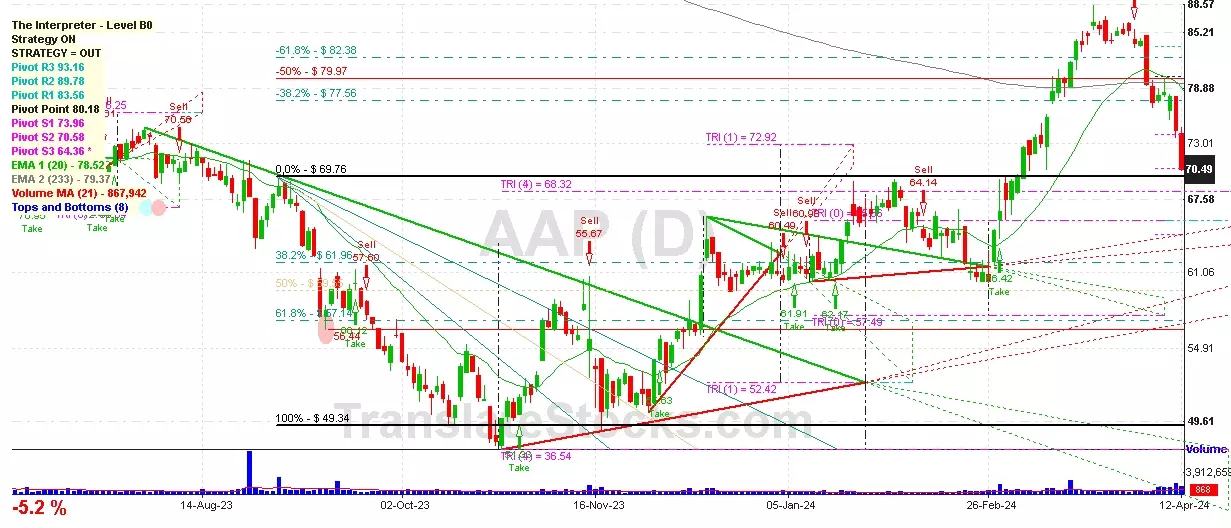
Advance Auto Parts Inc
IPO: 2001-11-29
Ticker: AAPIndices: S&P 500,
Exchange: New York Stock Exchange, Inc. (US - USD)
Website: https://shop.advanceautoparts.com/
Phone:
Common Stock
Trade & Services (
Retail-auto & Home Supply Stores

 Click to Enlarge