| Date | Price $ | Result % | Candle Name | Side |
|---|---|---|---|---|
| 001 13 Mar 2024 | Sell Price: 179.86 | Profit: Open Day2 ($ 179.84) | Dark Cloud Cover | Sell |
| 002 11 Mar 2024 | Buy Price: 179.63 | Profit: Open Day1 ($ 179.72) | Piercing Line | Buy |
| 003 03 Nov 2023 | Sell Price: 141.42 | Profit: Close Day1 ($ 141.20) | Dark Cloud Cover | Sell |
| 004 04 Oct 2023 | Buy Price: 148.01 | Profit: Close Day2 ($ 148.24) | Engulfing | Buy |
| 005 04 Oct 2023 | Buy Price: 147.69 | Profit: Open Day1 ($ 147.93) | Piercing Line | Buy |
| 006 15 Aug 2023 | Sell Price: 152.12 | Profit: Close Day1 ($ 151.55) | Abandoned Baby | Sell |
| 007 29 Jun 2023 | Buy Price: 133.23 | Profit: Open Day1 ($ 133.47) | Engulfing | Buy |
| 008One Year Average | Both Sides Result for 7 Signals |
Profit: $ 1.61 ($ 0.23 / Signal) |
All of Them | Buy + Sell |
| Simple Moving Averages (SMA) Period | Value $ | Signal | Exponential Moving Averages (EMA) Period | Value $ | Signal | |
|---|---|---|---|---|---|---|
| 2 | 163.39 | BUY | 2 | 163.67 | BUY | |
| 3 | 162.82 | BUY | 3 | 163.64 | BUY | |
| 5 | 163.65 | BUY | 5 | 164.36 | SELL | |
| 8 | 165.90 | SELL | 8 | 165.96 | SELL | |
| 13 | 169.53 | SELL | 13 | 168.36 | SELL | |
| 21 | 173.14 | SELL | 21 | 170.80 | SELL | |
| 34 | 175.46 | SELL | 34 | 172.19 | SELL | |
| 55 | 174.84 | SELL | 55 | 171.36 | SELL | |
| 90 | 168.52 | SELL | 90 | 167.97 | SELL | |
| 200 | 155.75 | BUY | 200 | 160.32 | BUY |
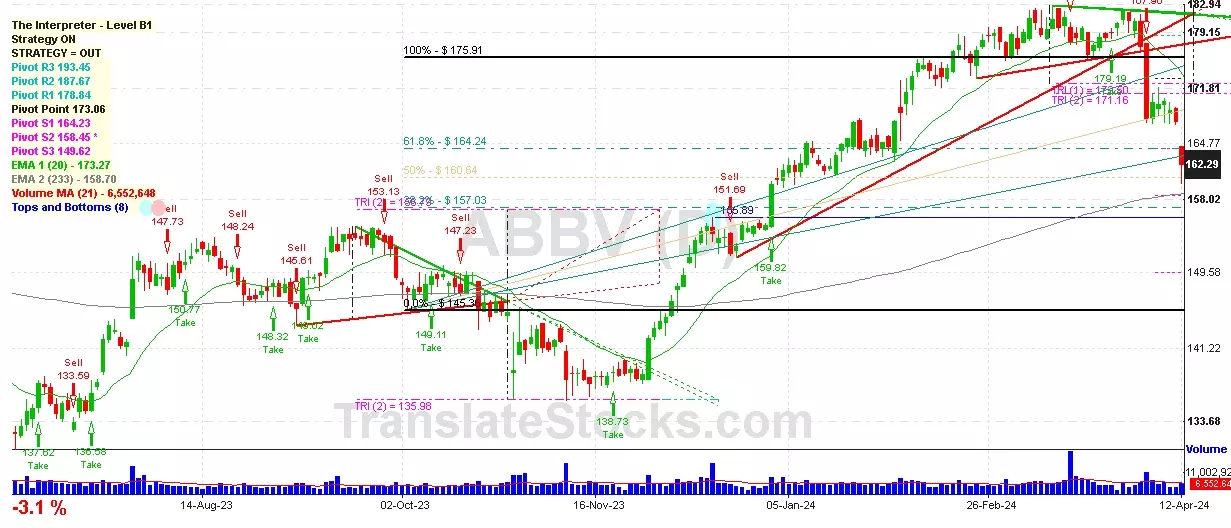
Abbvie Inc
IPO: 2013-01-02
Ticker: ABBVIndices: S&P 500,
Exchange: New York Stock Exchange, Inc. (US - USD)
Website: https://www.abbvie.com/
Phone:
Common Stock
Life Sciences (
Pharmaceutical Preparations

 Click to Enlarge