
| Date | Price $ | Result % | Candle Name | Side |
|---|---|---|---|---|
| 001 12 Mar 2024 | Buy Price: 380.48 | Profit: Open Day2 ($ 380.98) | Abandoned Baby | Buy |
| 002 05 Mar 2024 | Sell Price: 376.88 | Loss: Close Day2 ($ 387.07) | Abandoned Baby | Sell |
| 003 14 Feb 2024 | Buy Price: 370.98 | Profit: Open Day1 ($ 372.59) | Abandoned Baby | Buy |
| 004 26 Jan 2024 | Sell Price: 371.07 | Profit: Open Day1 ($ 370.52) | Abandoned Baby | Sell |
| 005 24 Jan 2024 | Sell Price: 368.90 | Loss: Close Day2 ($ 371.08) | Dark Cloud Cover | Sell |
| 006 03 Oct 2023 | Sell Price: 306.23 | Loss: Close Day2 ($ 309.62) | Abandoned Baby | Sell |
| 007 06 Jun 2023 | Buy Price: 308.04 | Profit: Open Day1 ($ 309.48) | Engulfing | Buy |
| 008 31 May 2023 | Sell Price: 305.92 | Profit: Open Day1 ($ 305.73) | Abandoned Baby | Sell |
| 009One Year Average | Both Sides Result for 8 Signals |
Loss: $ -11.47 ($ -1.43 / Signal) |
All of Them | Buy + Sell |
| Simple Moving Averages (SMA) Period | Value $ | Signal | Exponential Moving Averages (EMA) Period | Value $ | Signal | |
|---|---|---|---|---|---|---|
| 2 | 316.50 | BUY | 2 | 316.50 | BUY | |
| 3 | 315.84 | BUY | 3 | 316.28 | BUY | |
| 5 | 314.95 | BUY | 5 | 316.85 | BUY | |
| 8 | 317.47 | SELL | 8 | 319.02 | SELL | |
| 13 | 323.21 | SELL | 13 | 323.72 | SELL | |
| 21 | 329.41 | SELL | 21 | 331.16 | SELL | |
| 34 | 348.25 | SELL | 34 | 339.68 | SELL | |
| 55 | 356.91 | SELL | 55 | 345.67 | SELL | |
| 90 | 355.14 | SELL | 90 | 346.15 | SELL | |
| 200 | 333.25 | SELL | 200 | 334.64 | SELL |
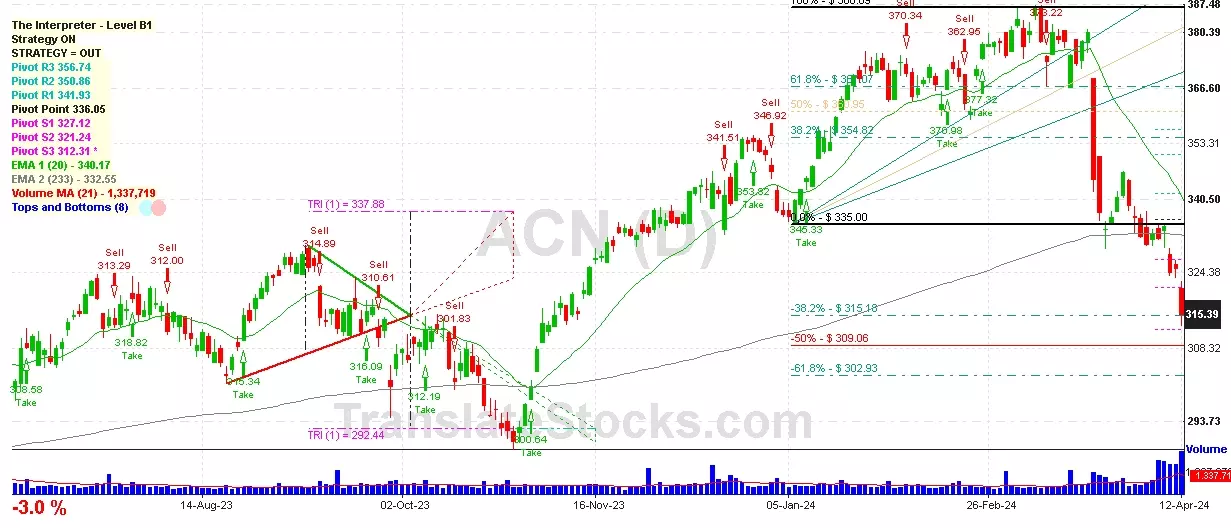
Accenture Plc-cl A
IPO: 2009-09-01
Ticker: ACNIndices: S&P 500,
Exchange: New York Stock Exchange, Inc. (IE - USD)
Website: https://www.accenture.com/ie-en/
Phone:
Common Stock
Trade & Services (
Services-business Services, Nec

 Click to Enlarge