| Date | Price $ | Result % | Candle Name | Side |
|---|---|---|---|---|
| 001 29 Feb 2024 | Buy Price: 560.28 | Profit: Open Day1 ($ 561.11) | Abandoned Baby | Buy |
| 002 27 Feb 2024 | Sell Price: 552.49 | Profit: Open Day1 ($ 552.00) | Engulfing | Sell |
| 003 14 Feb 2024 | Buy Price: 604.66 | Profit: Open Day1 ($ 606.00) | Abandoned Baby | Buy |
| 004 19 Oct 2023 | Sell Price: 555.74 | Profit: Close Day1 ($ 540.96) | Dark Cloud Cover | Sell |
| 005 13 Oct 2023 | Sell Price: 548.76 | Profit: Open Day2 ($ 545.41) | Engulfing | Sell |
| 006 18 Sep 2023 | Buy Price: 532.42 | Profit: Close Day1 ($ 541.69) | Engulfing | Buy |
| 007 18 Sep 2023 | Buy Price: 532.37 | Profit: Close Day1 ($ 541.69) | Piercing Line | Buy |
| 008 20 Jun 2023 | Sell Price: 485.86 | Profit: Close Day1 ($ 477.48) | Abandoned Baby | Sell |
| 009One Year Average | Both Sides Result for 8 Signals |
Profit: $ 47.76 ($ 5.97 / Signal) |
All of Them | Buy + Sell |
| Simple Moving Averages (SMA) Period | Value $ | Signal | Exponential Moving Averages (EMA) Period | Value $ | Signal | |
|---|---|---|---|---|---|---|
| 2 | 475.01 | BUY | 2 | 475.09 | BUY | |
| 3 | 472.30 | BUY | 3 | 473.85 | BUY | |
| 5 | 471.02 | BUY | 5 | 473.18 | BUY | |
| 8 | 471.99 | BUY | 8 | 474.28 | BUY | |
| 13 | 476.79 | BUY | 13 | 478.35 | SELL | |
| 21 | 485.02 | SELL | 21 | 487.06 | SELL | |
| 34 | 504.16 | SELL | 34 | 501.72 | SELL | |
| 55 | 530.66 | SELL | 55 | 520.12 | SELL | |
| 90 | 557.64 | SELL | 90 | 535.41 | SELL | |
| 200 | 552.93 | SELL | 200 | 528.65 | SELL |
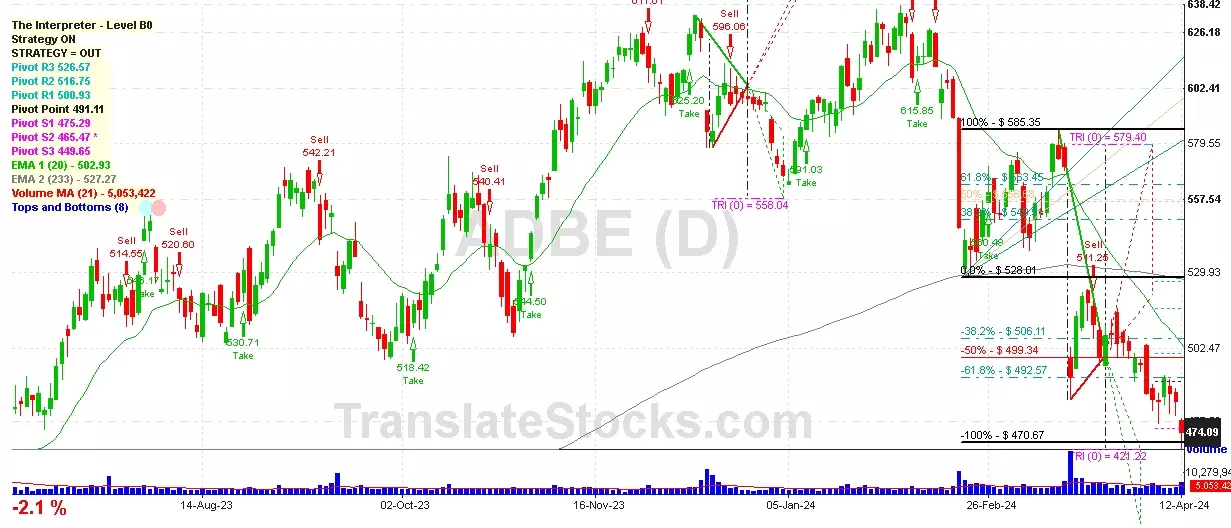
Adobe Inc
IPO: 1986-01-08
Ticker: ADBEIndices: S&P 500,
Nasdaq 100,
Exchange: Nasdaq Nms - Global Market (US - USD)
Website: https://www.adobe.com/
Phone:
Common Stock
Technology (
Services-prepackaged Software

 Click to Enlarge