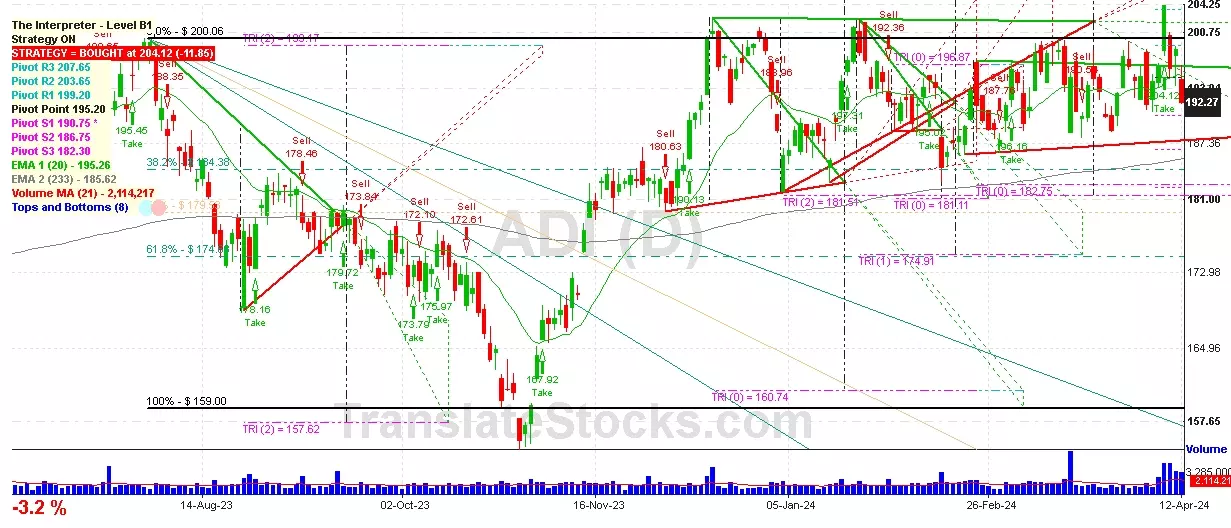
Hey Friend, I'm analysing ANALOG DEVICES INC (ADI), and it is between the Support of $ 190.75 (PivotS1) and the Resistance of $ 195.20 (Pivot). The stock is also approaching the line of PivotS1 at $ 190.75, and if it goes below this line it could reach the next Support of 38.2% of Fibonacci at $ 184.38.

| Date | Price $ | Result % | Candle Name | Side |
|---|---|---|---|---|
| 001 29 Feb 2024 | Buy Price: 191.82 | Profit: Open Day1 ($ 192.55) | Abandoned Baby | Buy |
| 002 12 Feb 2024 | Sell Price: 194.05 | Profit: Open Day1 ($ 188.16) | Abandoned Baby | Sell |
| 003 02 Feb 2024 | Buy Price: 192.26 | Profit: Open Day1 ($ 192.79) | Engulfing | Buy |
| 004 02 Feb 2024 | Buy Price: 192.10 | Profit: Open Day1 ($ 192.79) | Piercing Line | Buy |
| 005 12 Jan 2024 | Sell Price: 188.36 | Profit: Open Day1 ($ 187.85) | Engulfing | Sell |
| 006 05 Sep 2023 | Sell Price: 181.54 | Profit: Open Day2 ($ 179.94) | Abandoned Baby | Sell |
| 007 22 Jun 2023 | Buy Price: 186.11 | Profit: Open Day2 ($ 187.85) | Engulfing | Buy |
| 008One Year Average | Both Sides Result for 7 Signals |
Profit: $ 11.69 ($ 1.67 / Signal) |
All of Them | Buy + Sell |
| Simple Moving Averages (SMA) Period | Value $ | Signal | Exponential Moving Averages (EMA) Period | Value $ | Signal | |
|---|---|---|---|---|---|---|
| 2 | 197.22 | BUY | 2 | 196.58 | BUY | |
| 3 | 194.79 | BUY | 3 | 195.13 | BUY | |
| 5 | 190.81 | BUY | 5 | 193.35 | BUY | |
| 8 | 190.29 | BUY | 8 | 192.47 | BUY | |
| 13 | 192.61 | BUY | 13 | 192.40 | BUY | |
| 21 | 193.59 | BUY | 21 | 192.70 | BUY | |
| 34 | 193.86 | BUY | 34 | 192.90 | BUY | |
| 55 | 192.84 | BUY | 55 | 192.52 | BUY | |
| 90 | 193.12 | BUY | 90 | 191.14 | BUY | |
| 200 | 185.66 | BUY | 200 | 186.98 | BUY |
Analog Devices Inc
IPO: 1979-04-03
Ticker: ADIIndices: S&P 500,
Nasdaq 100,
Exchange: Nasdaq Nms - Global Market (US - USD)
Website: http://www.analog.com/
Phone:
Common Stock
Manufacturing (
Semiconductors & Related Devices
 Click to Enlarge