| Date | Price $ | Result % | Candle Name | Side |
|---|---|---|---|---|
| 001 01 Apr 2024 | Sell Price: 84.56 | Profit: Open Day1 ($ 84.20) | Engulfing | Sell |
| 002 07 Dec 2023 | Sell Price: 80.20 | Profit: Open Day1 ($ 80.12) | Dark Cloud Cover | Sell |
| 003 21 Nov 2023 | Buy Price: 78.04 | Profit: Close Day1 ($ 78.25) | Abandoned Baby | Buy |
| 004 21 Sep 2023 | Sell Price: 79.88 | Profit: Open Day1 ($ 79.46) | Abandoned Baby | Sell |
| 005 01 May 2023 | Buy Price: 92.65 | Profit: Open Day1 ($ 92.75) | Engulfing | Buy |
| 006One Year Average | Both Sides Result for 5 Signals |
Profit: $ 1.17 ($ 0.23 / Signal) |
All of Them | Buy + Sell |
| Simple Moving Averages (SMA) Period | Value $ | Signal | Exponential Moving Averages (EMA) Period | Value $ | Signal | |
|---|---|---|---|---|---|---|
| 2 | 81.51 | SELL | 2 | 81.43 | SELL | |
| 3 | 81.97 | SELL | 3 | 81.84 | SELL | |
| 5 | 82.86 | SELL | 5 | 82.42 | SELL | |
| 8 | 83.31 | SELL | 8 | 82.91 | SELL | |
| 13 | 83.96 | SELL | 13 | 83.24 | SELL | |
| 21 | 83.49 | SELL | 21 | 83.30 | SELL | |
| 34 | 83.64 | SELL | 34 | 83.01 | SELL | |
| 55 | 81.92 | SELL | 55 | 82.42 | SELL | |
| 90 | 81.53 | SELL | 90 | 81.74 | SELL | |
| 200 | 80.32 | BUY | 200 | 82.09 | SELL |
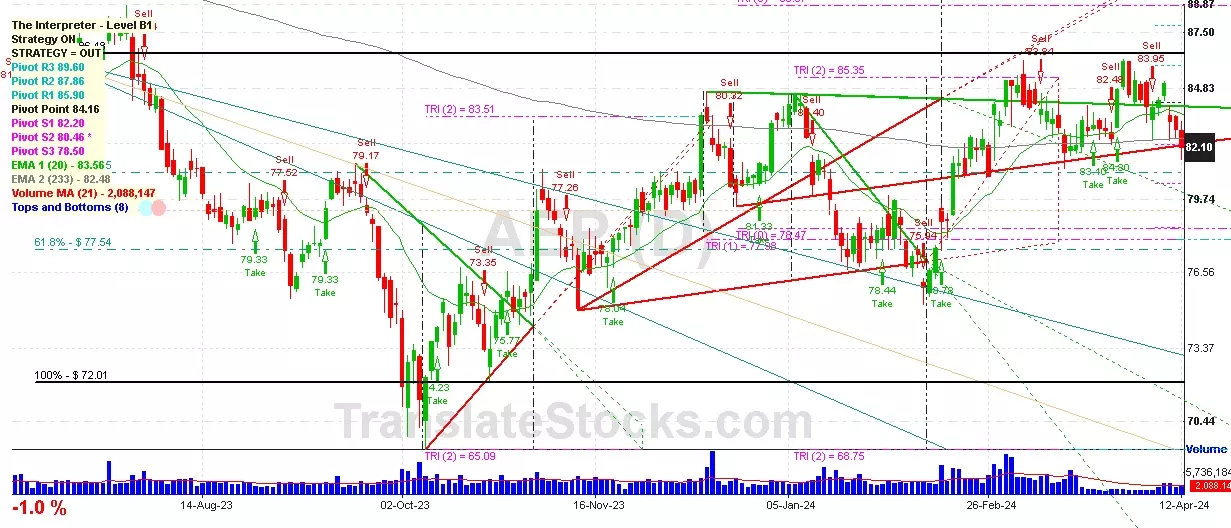
American Electric Power
IPO: 1949-09-01
Ticker: AEPIndices: S&P 500,
Nasdaq 100,
Exchange: Nasdaq Nms - Global Market (US - USD)
Website: http://www.aep.com/
Phone:
Common Stock
Energy & Transportation (
Electric Services

 Click to Enlarge