| Date | Price $ | Result % | Candle Name | Side |
|---|---|---|---|---|
| 001 02 Apr 2024 | Buy Price: 78.02 | Profit: Open Day1 ($ 78.18) | Engulfing | Buy |
| 002 22 Mar 2024 | Sell Price: 76.38 | Loss: Close Day2 ($ 77.40) | Engulfing | Sell |
| 003 11 Mar 2024 | Buy Price: 74.91 | Profit: Open Day1 ($ 74.92) | Engulfing | Buy |
| 004 12 Oct 2023 | Sell Price: 61.14 | Profit: Close Day1 ($ 61.09) | Engulfing | Sell |
| 005 26 Jun 2023 | Buy Price: 55.67 | Profit: Close Day1 ($ 56.45) | Abandoned Baby | Buy |
| 006 24 Apr 2023 | Buy Price: 51.82 | Loss: Close Day2 ($ 50.83) | Piercing Line | Buy |
| 007One Year Average | Both Sides Result for 6 Signals |
Loss: $ -1.01 ($ -0.17 / Signal) |
All of Them | Buy + Sell |
| Simple Moving Averages (SMA) Period | Value $ | Signal | Exponential Moving Averages (EMA) Period | Value $ | Signal | |
|---|---|---|---|---|---|---|
| 2 | 73.61 | BUY | 2 | 73.81 | BUY | |
| 3 | 73.27 | BUY | 3 | 73.65 | BUY | |
| 5 | 73.33 | BUY | 5 | 73.69 | BUY | |
| 8 | 73.73 | BUY | 8 | 74.03 | BUY | |
| 13 | 75.03 | SELL | 13 | 74.57 | SELL | |
| 21 | 75.97 | SELL | 21 | 74.90 | SELL | |
| 34 | 75.66 | SELL | 34 | 74.62 | SELL | |
| 55 | 73.56 | BUY | 55 | 73.54 | BUY | |
| 90 | 71.35 | BUY | 90 | 71.61 | BUY | |
| 200 | 65.72 | BUY | 200 | 67.12 | BUY |
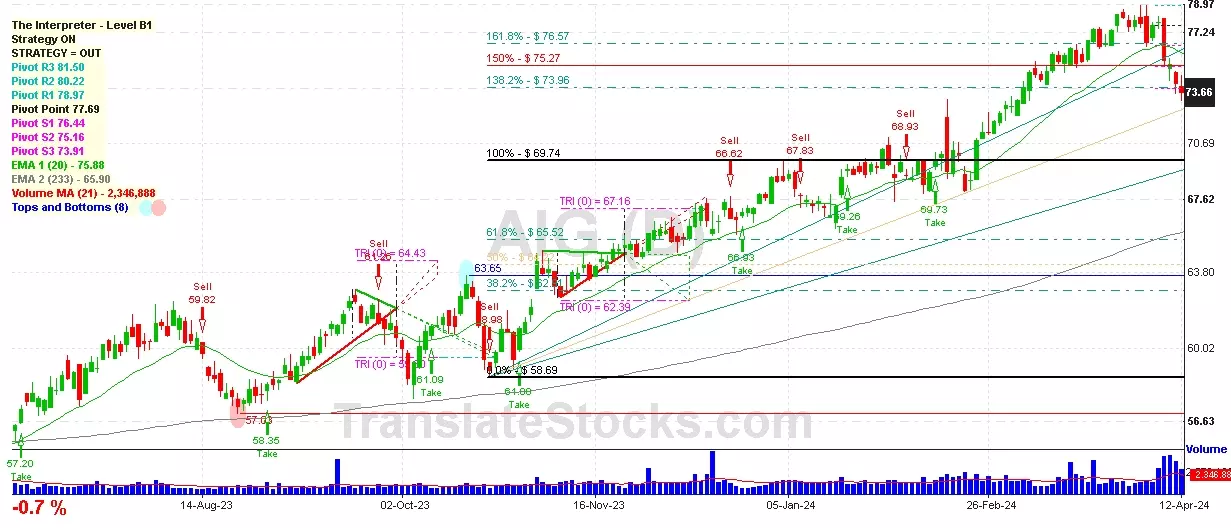
American International Group
IPO: 1984-10-08
Ticker: AIGIndices: S&P 500,
Exchange: New York Stock Exchange, Inc. (US - USD)
Website: http://www.aig.com
Phone:
Common Stock
Finance (
Fire, Marine & Casualty Insurance

 Click to Enlarge