| Date | Price $ | Result % | Candle Name | Side |
|---|---|---|---|---|
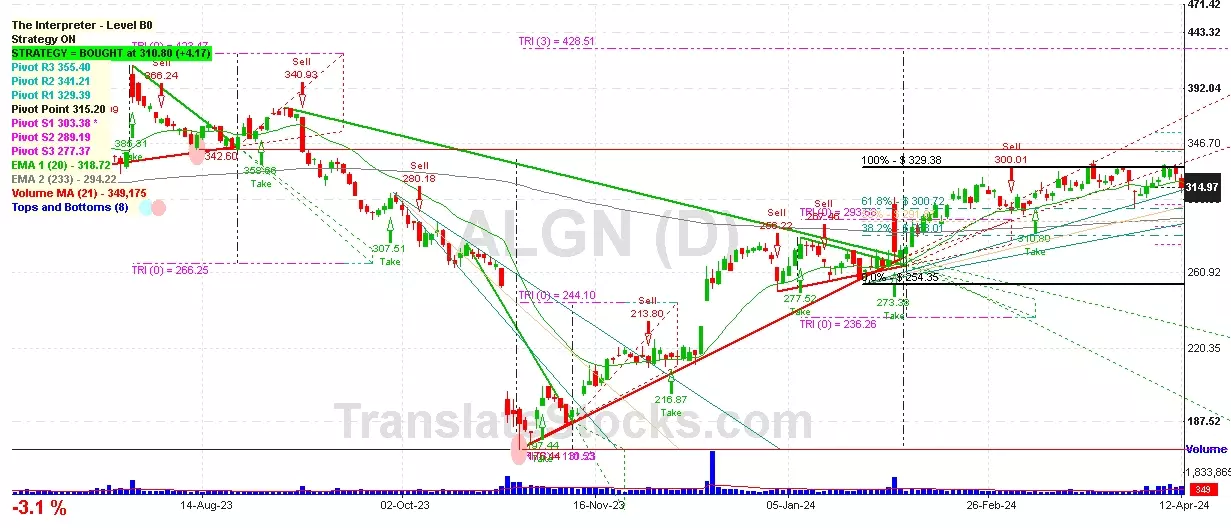
| 001 01 Apr 2024 | Sell Price: 319.65 | Profit: Open Day1 ($ 312.41) | Abandoned Baby | Sell |
| 002 26 Mar 2024 | Buy Price: 319.94 | Profit: Open Day1 ($ 325.10) | Abandoned Baby | Buy |
| 003 18 Mar 2024 | Buy Price: 316.14 | Profit: Close Day1 ($ 317.20) | Abandoned Baby | Buy |
| 004 11 Mar 2024 | Sell Price: 308.09 | Loss: Close Day2 ($ 320.69) | Abandoned Baby | Sell |
| 005 04 Mar 2024 | Buy Price: 308.04 | Loss: Close Day2 ($ 303.79) | Abandoned Baby | Buy |
| 006 27 Nov 2023 | Sell Price: 216.75 | Profit: Close Day1 ($ 214.14) | Abandoned Baby | Sell |
| 007 22 Aug 2023 | Buy Price: 351.63 | Profit: Open Day1 ($ 353.55) | Engulfing | Buy |
| 008 11 Aug 2023 | Buy Price: 352.86 | Profit: Close Day1 ($ 360.49) | Engulfing | Buy |
| 009 11 Aug 2023 | Buy Price: 352.88 | Profit: Close Day1 ($ 360.49) | Piercing Line | Buy |
| 010 26 Jun 2023 | Buy Price: 331.46 | Profit: Open Day1 ($ 333.29) | Engulfing | Buy |
| 011 23 Jun 2023 | Sell Price: 328.83 | Profit: Open Day1 ($ 328.01) | Abandoned Baby | Sell |
| 012 28 Apr 2023 | Buy Price: 325.30 | Loss: Close Day2 ($ 306.84) | Engulfing | Buy |
| 013One Year Average | Both Sides Result for 12 Signals |
Profit: $ 0.57 ($ 0.05 / Signal) |
All of Them | Buy + Sell |
| Simple Moving Averages (SMA) Period | Value $ | Signal | Exponential Moving Averages (EMA) Period | Value $ | Signal | |
|---|---|---|---|---|---|---|
| 2 | 300.16 | SELL | 2 | 299.87 | SELL | |
| 3 | 300.15 | SELL | 3 | 300.94 | SELL | |
| 5 | 302.06 | SELL | 5 | 303.57 | SELL | |
| 8 | 309.75 | SELL | 8 | 306.93 | SELL | |
| 13 | 313.15 | SELL | 13 | 310.27 | SELL | |
| 21 | 316.11 | SELL | 21 | 312.12 | SELL | |
| 34 | 314.89 | SELL | 34 | 310.74 | SELL | |
| 55 | 308.91 | SELL | 55 | 304.84 | SELL | |
| 90 | 291.30 | BUY | 90 | 296.95 | BUY | |
| 200 | 293.11 | BUY | 200 | 292.09 | BUY |
Align Technology Inc
IPO: 2001-01-26
Ticker: ALGNIndices: S&P 500,
Nasdaq 100,
Exchange: Nasdaq Nms - Global Market (US - USD)
Website: http://www.aligntech.com/
Phone:
Common Stock
Life Sciences (
Orthopedic, Prosthetic & Surgical Appliances & Supplies
Year | 2020 | 2019 | 2018 | 2017 | 2016 | 2015 | 2014 | 2013 | 2012 | 2011 | 2010 | 2009 | 2008 | 2007 | |
|---|---|---|---|---|---|---|---|---|---|---|---|---|---|---|---|
| 1 | Assets + | 4,830 | 2,501 | 2,052 | 1,778 | 1,396 | 1,159 | 988 | 832 | 756 | 649 | 477 | 355 | 87 | 89 |
| 2 | Investments in and Advance to Affiliates + | 0 | 0 | 46 | 55 | 45 | 0 | 0 | 0 | 0 | 0 | 0 | 0 | 0 | 0 |
| 3 | Cash and Cash Equivalents + | 961 | 550 | 637 | 450 | 389 | 168 | 200 | 243 | 306 | 241 | 295 | 166 | 87 | 89 |
| 4 | Property + | 735 | 632 | 521 | 349 | 175 | 136 | 90 | 76 | 79 | 54 | 31 | 25 | 0 | 0 |
| 5 | Property + | 1,036 | 861 | 693 | 485 | 311 | 255 | 198 | 181 | 165 | 129 | 98 | 0 | 0 | 0 |
| 6 | Intangible Assets + | 130 | 12 | 18 | 24 | 21 | 18 | 21 | 24 | 46 | 50 | 2 | 5 | 0 | 0 |
| 7 | Finite-Lived Intangible Assets + | 117 | 12 | 18 | 24 | 21 | 18 | 21 | 24 | 46 | 50 | 0 | 0 | 0 | 0 |
| 8 | Liabilities and Equity + | 4,830 | 2,501 | 2,052 | 1,778 | 1,396 | 1,159 | 988 | 832 | 756 | 649 | 477 | 355 | 219 | 161 |
| 9 | Liabilities + | 1,596 | 1,155 | 800 | 627 | 401 | 311 | 235 | 198 | 175 | 158 | 99 | 82 | 0 | 0 |
| 10 | Stockholders' Equity + | 3,234 | 1,346 | 1,253 | 1,150 | 995 | 848 | 753 | 634 | 581 | 491 | 378 | 273 | 219 | 161 |
| 11 | Stockholders' Equity Attributable to Parent + | 3,234 | 1,346 | 1,253 | 1,150 | 995 | 848 | 753 | 634 | 581 | 491 | 378 | 273 | 219 | 161 |
| 12 | Preferred Stock + | 0 | 0 | 0 | 0 | 0 | 0 | 0 | 0 | 0 | 0 | 0 | 0 | 0 | 0 |
| 13 | Common Stock + | 0 | 0 | 0 | 0 | 0 | 0 | 0 | 0 | 0 | 0 | 0 | 0 | 0 | 0 |
| 14 | Partners' Capital + | 2,216 | 440 | 378 | 263 | 131 | 27 | -31 | -96 | -90 | -117 | -178 | -252 | 0 | 0 |
| 15 | Partners' Capital + | 2,216 | 440 | 378 | 263 | 131 | 27 | -31 | -96 | -90 | -117 | -178 | -252 | 0 | 0 |
| 16 | Limited Liability Company (LLC) Members' Equity + | 2,260 | 439 | 375 | 264 | 130 | 26 | -31 | -96 | -90 | -117 | -178 | -252 | 0 | 0 |
| 17 | Limited Liability Company (LLC) Members' Equity + | 2,260 | 439 | 375 | 264 | 130 | 26 | -31 | -96 | -90 | -117 | -178 | -252 | 0 | 0 |
| 18 | Current Assets + | 1,850 | 1,633 | 1,302 | 1,157 | 953 | 732 | 657 | 545 | 486 | 385 | 389 | 261 | 0 | 0 |
| 19 | Cash + | 0 | 318 | 98 | 272 | 251 | 364 | 259 | 127 | 30 | 11 | 9 | 20 | 0 | 0 |
| 20 | Current Receivables + | 663 | 575 | 439 | 323 | 247 | 159 | 130 | 113 | 99 | 92 | 65 | 55 | 0 | 0 |
| 21 | Inventory + | 139 | 112 | 56 | 32 | 27 | 19 | 16 | 14 | 15 | 9 | 3 | 2 | 0 | 0 |
| 22 | Long-Term Assets + | 2,116 | 224 | 91 | 103 | 74 | 69 | 69 | 71 | 102 | 138 | 3 | 2 | 0 | 0 |
| 23 | Long-term Investments and Receivables + | 0 | 0 | 9 | 40 | 60 | 151 | 148 | 102 | 21 | 0 | 9 | 0 | 0 | 0 |
| 24 | Current Liabilities + | 1,326 | 971 | 692 | 498 | 354 | 272 | 202 | 175 | 156 | 148 | 93 | 81 | 0 | 0 |
| 25 | Long-Term Other Undisclosed Liabilities | 0 | 1 | 79 | 113 | 46 | 37 | 30 | 18 | 0 | 0 | 0 | 0 | 0 | 0 |
| 26 | Long-Term Liabilities + | 270 | 184 | 108 | 129 | 47 | 39 | 33 | 23 | 19 | 10 | 6 | 1 | 0 | 0 |
| 27 | Current Other Assets + | 21 | 4 | 7 | 0 | 0 | 0 | 0 | 0 | 0 | 0 | 0 | 0 | 0 | 0 |
| 28 | Total Current Assets + | 1,850 | 1,633 | 1,302 | 1,157 | 953 | 732 | 657 | 545 | 486 | 385 | 389 | 261 | 0 | 0 |
| 29 | Operating Lease + | 83 | 56 | 0 | 0 | 0 | 0 | 0 | 0 | 0 | 0 | 0 | 0 | 0 | 0 |
| 30 | Goodwill + | 445 | 64 | 64 | 65 | 61 | 61 | 61 | 62 | 99 | 135 | 0 | 0 | 0 | 0 |
| 31 | Long-Term Other Assets + | 35 | 40 | 27 | 38 | 13 | 8 | 8 | 9 | 3 | 3 | 3 | 2 | 0 | 0 |
| 32 | Deferred Income Tax Assets + | 1,588 | 104 | 0 | 0 | 0 | 0 | 0 | 0 | 0 | 0 | 0 | 0 | 0 | 0 |
| 33 | Total Assets + | 4,830 | 2,501 | 2,052 | 1,778 | 1,396 | 1,159 | 988 | 832 | 756 | 649 | 477 | 355 | 0 | 0 |
| 34 | Total Liabilities + | 1,596 | 1,155 | 800 | 627 | 401 | 311 | 235 | 198 | 175 | 158 | 99 | 82 | 0 | 0 |
| 35 | Total Liabilities and Equity + | 4,830 | 2,501 | 2,052 | 1,778 | 1,396 | 1,159 | 988 | 832 | 756 | 649 | 477 | 355 | 0 | 0 |
Year | 2020 | 2019 | 2018 | 2017 | 2016 | 2015 | 2014 | 2013 | 2012 | 2011 | 2010 | 2009 | 2008 | |
|---|---|---|---|---|---|---|---|---|---|---|---|---|---|---|
| 1 | 0 | 0 | 0 | 0 | 0 | 0 | 0 | 0 | 0 | 0 | 387 | 312 | 304 | |
| 2 | 0 | 0 | 0 | 0 | 0 | 0 | 0 | 0 | 0 | 0 | 9 | 7 | 9 | |
| 3 | -709 | -663 | -519 | -356 | -265 | -205 | -183 | -162 | -144 | -118 | -84 | -79 | -79 | |
| 4 | 1,763 | 1,744 | 1,448 | 1,117 | 815 | 640 | 578 | 498 | 416 | 361 | 303 | 233 | 225 | |
| 5 | 175 | 157 | 129 | 98 | 76 | 61 | 53 | 44 | 43 | 37 | 26 | 22 | 26 | |
| 6 | 80 | 79 | 55 | 38 | 24 | 18 | 15 | 14 | 13 | 12 | 11 | 10 | 10 | |
| 7 | 0 | -51 | 0 | 0 | 0 | 0 | 0 | 0 | 0 | 0 | 5 | 70 | 0 | |
| 8 | 0 | 0 | 0 | 0 | 0 | 0 | 0 | 0 | 0 | 0 | -4 | 0 | 0 | |
| 9 | 0 | 1,072 | 852 | 666 | 491 | 390 | 217 | 180 | 152 | 142 | 114 | 113 | 115 | |
| 10 | 0 | 0 | 0 | 0 | 0 | 0 | 115 | 113 | 96 | 89 | 65 | 62 | 62 | |
| 11 | 1,201 | 1,072 | 852 | 0 | 0 | 390 | 332 | 293 | 0 | 0 | 0 | 0 | 0 | |
| 12 | 12 | 6 | 1 | 0 | 0 | 0 | 0 | 0 | 0 | 0 | 0 | 1 | 0 | |
| 13 | 0 | 0 | 0 | 0 | 0 | 0 | 0 | 0 | 0 | 0 | 0 | 0 | -1 | |
| 14 | 0 | 7 | 0 | 0 | 0 | 0 | 0 | 0 | 0 | 0 | 0 | 0 | 0 | |
| 15 | 0 | 16 | 0 | 0 | 0 | 0 | 0 | 0 | 0 | 0 | 0 | 0 | 0 | |
| 16 | -1,376 | -1,201 | -981 | -763 | -566 | -451 | -385 | -404 | -331 | -271 | -201 | -268 | -210 | |
| 17 | 387 | 542 | 467 | 354 | 249 | 189 | 194 | 94 | 86 | 90 | 103 | -34 | 16 | |
| 18 | 0 | 0 | 0 | 0 | 0 | 0 | 0 | 0 | 1 | 1 | 1 | 1 | 3 | |
| 19 | 0 | 7 | 0 | 0 | 0 | 0 | 0 | 0 | 0 | 0 | 0 | 0 | 0 | |
| 20 | 0 | 0 | 0 | 0 | 0 | 0 | 0 | 0 | 0 | 0 | 1 | 0 | 0 | |
| 21 | 0 | 0 | 0 | 0 | 0 | 0 | 0 | 0 | 0 | -1 | -1 | 0 | -1 | |
| 22 | 0 | 8 | -8 | 11 | -6 | -3 | -3 | -1 | -2 | -1 | -1 | 0 | 0 | |
| 23 | -11 | 8 | -8 | 0 | 0 | 0 | 0 | 0 | 0 | 0 | 0 | 0 | 0 | |
| 24 | 0 | 0 | 0 | 0 | 0 | 0 | 0 | 0 | 0 | 0 | 0 | 0 | 0 | |
| 25 | 379 | 563 | 467 | 365 | 243 | 186 | 190 | 93 | 84 | 90 | 102 | -34 | 17 | |
| 26 | 0 | -8 | -9 | -3 | -2 | 0 | 0 | 0 | 0 | 0 | 0 | 0 | 0 | |
| 27 | 1,397 | -112 | -58 | -130 | -51 | -42 | -45 | -29 | -26 | -23 | -28 | 3 | 63 | |
| 28 | Total Net Income (Loss) Attributable to Parent + | 1,776 | 443 | 400 | 231 | 190 | 144 | 146 | 64 | 59 | 67 | 74 | -31 | 80 |
| 29 | Total Earnings Per Share + | 22.55 | 5.57 | 5 | 2.89 | 2.38 | 1.80 | 1.81 | 0.80 | 0.73 | 0.86 | 0.98 | -0.45 | 1.20 |
| 30 | Total Earnings Per Share + | 22.41 | 5.53 | 4.92 | 2.83 | 2.33 | 1.77 | 1.77 | 0.78 | 0.71 | 0.83 | 0.95 | -0.45 | 1.18 |

 Click to Enlarge