| Date | Price $ | Result % | Candle Name | Side |
|---|---|---|---|---|
| 001 01 Apr 2024 | Sell Price: 132.32 | Profit: Open Day1 ($ 132.17) | Abandoned Baby | Sell |
| 002 06 Feb 2024 | Buy Price: 126.03 | Profit: Open Day1 ($ 126.93) | Piercing Line | Buy |
| 003 29 Nov 2023 | Buy Price: 104.59 | Profit: Open Day1 ($ 104.82) | Abandoned Baby | Buy |
| 004 24 Oct 2023 | Buy Price: 97.11 | Profit: Open Day2 ($ 97.53) | Abandoned Baby | Buy |
| 005 16 Oct 2023 | Buy Price: 105.26 | Profit: Close Day1 ($ 105.59) | Abandoned Baby | Buy |
| 006 19 Sep 2023 | Buy Price: 105.84 | Profit: Open Day1 ($ 106.68) | Engulfing | Buy |
| 007 05 Sep 2023 | Sell Price: 111.14 | Profit: Open Day1 ($ 109.26) | Abandoned Baby | Sell |
| 008 20 Jul 2023 | Sell Price: 124.62 | Loss: Close Day2 ($ 126.32) | Engulfing | Sell |
| 009 26 Jun 2023 | Buy Price: 117.17 | Profit: Open Day1 ($ 117.61) | Abandoned Baby | Buy |
| 010 22 Jun 2023 | Sell Price: 116.39 | Profit: Open Day1 ($ 115.61) | Engulfing | Sell |
| 011 19 May 2023 | Sell Price: 109.30 | Profit: Open Day1 ($ 109.27) | Dark Cloud Cover | Sell |
| 012 21 Apr 2023 | Sell Price: 102.99 | Profit: Close Day2 ($ 101.97) | Engulfing | Sell |
| 013One Year Average | Both Sides Result for 12 Signals |
Profit: $ 5.32 ($ 0.44 / Signal) |
All of Them | Buy + Sell |
| Simple Moving Averages (SMA) Period | Value $ | Signal | Exponential Moving Averages (EMA) Period | Value $ | Signal | |
|---|---|---|---|---|---|---|
| 2 | 126.09 | SELL | 2 | 126.11 | SELL | |
| 3 | 126.38 | SELL | 3 | 126.48 | SELL | |
| 5 | 127.26 | SELL | 5 | 127.29 | SELL | |
| 8 | 129.02 | SELL | 8 | 128.31 | SELL | |
| 13 | 130.07 | SELL | 13 | 129.38 | SELL | |
| 21 | 131.61 | SELL | 21 | 130.13 | SELL | |
| 34 | 131.02 | SELL | 34 | 130.13 | SELL | |
| 55 | 130.34 | SELL | 55 | 128.78 | SELL | |
| 90 | 126.66 | SELL | 90 | 125.77 | BUY | |
| 200 | 116.61 | BUY | 200 | 119.60 | BUY |
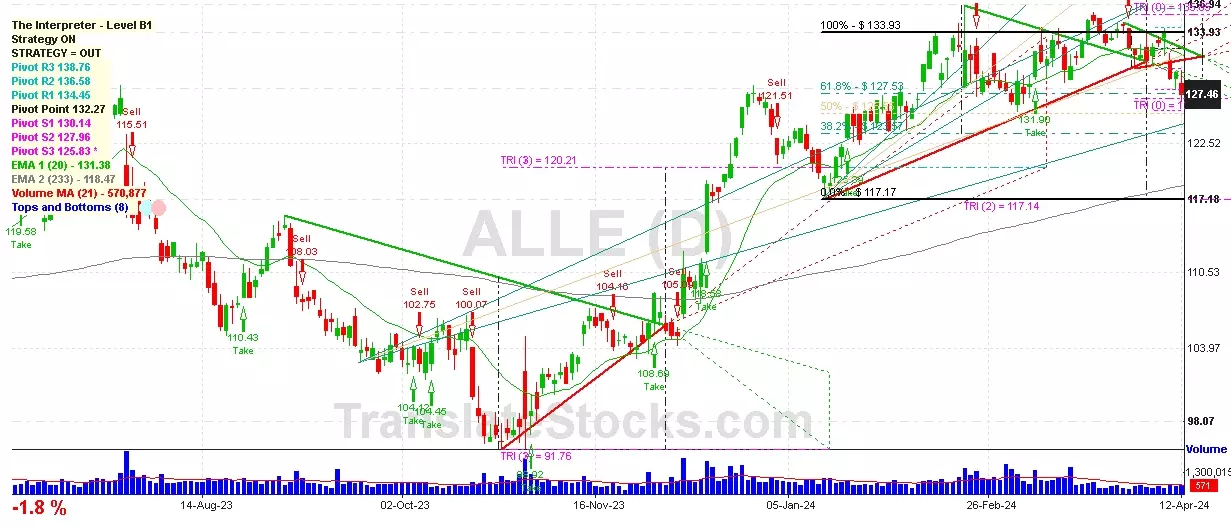
Allegion Plc
IPO: 2013-11-18
Ticker: ALLEIndices: S&P 500,
Exchange: New York Stock Exchange, Inc. (IE - USD)
Website: https://www.allegion.com/corp/en/index.html
Phone:
Common Stock
Trade & Services (
Services-detective, Guard & Armored Car Services

 Click to Enlarge