
| Date | Price $ | Result % | Candle Name | Side |
|---|---|---|---|---|
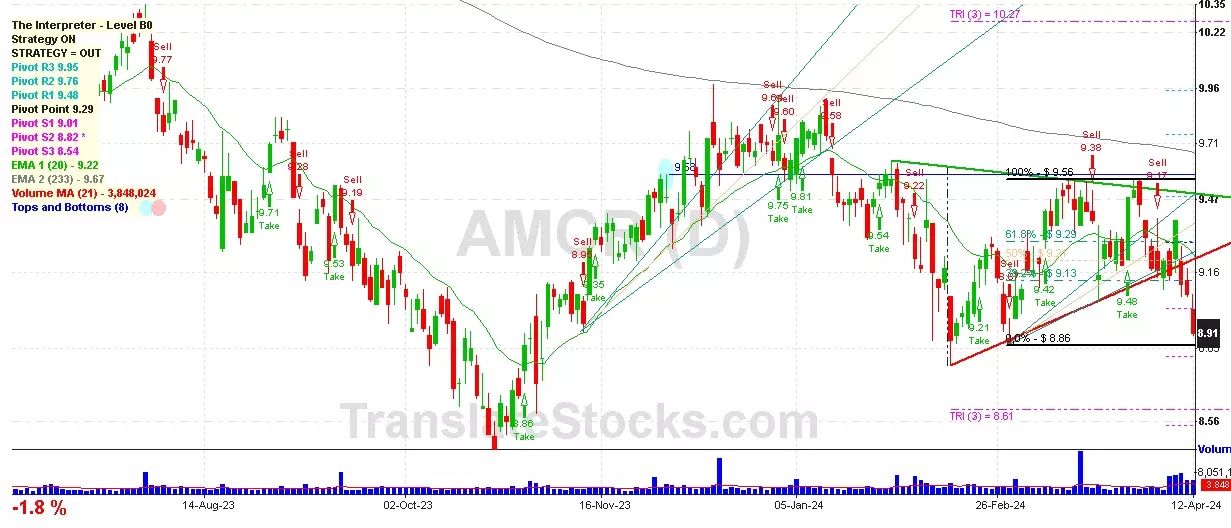
| 001 21 Mar 2024 | Buy Price: 9.28 | Profit: Open Day1 ($ 9.29) | Abandoned Baby | Buy |
| 002 15 Mar 2024 | Buy Price: 9.48 | Loss: Close Day2 ($ 9.39) | Engulfing | Buy |
| 003 14 Mar 2024 | Sell Price: 9.43 | Profit: Open Day1 ($ 9.36) | Abandoned Baby | Sell |
| 004 29 Feb 2024 | Buy Price: 9.06 | Profit: Close Day1 ($ 9.09) | Abandoned Baby | Buy |
| 005 26 Feb 2024 | Sell Price: 9.14 | Profit: Open Day1 ($ 9.07) | Abandoned Baby | Sell |
| 006 12 Feb 2024 | Buy Price: 9.18 | Loss: Close Day2 ($ 8.95) | Abandoned Baby | Buy |
| 007 28 Nov 2023 | Sell Price: 9.30 | Loss: Close Day2 ($ 9.48) | Dark Cloud Cover | Sell |
| 008 26 Oct 2023 | Buy Price: 8.68 | Profit: Open Day1 ($ 8.73) | Engulfing | Buy |
| 009 25 Sep 2023 | Buy Price: 9.19 | Loss: Close Day2 ($ 9.04) | Engulfing | Buy |
| 010 13 Sep 2023 | Sell Price: 9.21 | Loss: Close Day2 ($ 9.35) | Abandoned Baby | Sell |
| 011 26 Jul 2023 | Sell Price: 10.15 | Loss: Close Day2 ($ 10.22) | Abandoned Baby | Sell |
| 012 20 Jul 2023 | Sell Price: 9.94 | Loss: Close Day2 ($ 10.12) | Engulfing | Sell |
| 013 20 Jul 2023 | Sell Price: 9.95 | Loss: Close Day2 ($ 10.12) | Dark Cloud Cover | Sell |
| 014 18 Jul 2023 | Buy Price: 9.95 | Profit: Close Day1 ($ 9.98) | Engulfing | Buy |
| 015 06 Jul 2023 | Buy Price: 9.83 | Profit: Close Day1 ($ 9.94) | Piercing Line | Buy |
| 016 19 May 2023 | Buy Price: 10.23 | Profit: Close Day1 ($ 10.27) | Abandoned Baby | Buy |
| 017 25 Apr 2023 | Sell Price: 10.82 | Profit: Open Day1 ($ 10.74) | Abandoned Baby | Sell |
| 018One Year Average | Both Sides Result for 17 Signals |
Loss: $ -0.72 ($ -0.04 / Signal) |
All of Them | Buy + Sell |
| Simple Moving Averages (SMA) Period | Value $ | Signal | Exponential Moving Averages (EMA) Period | Value $ | Signal | |
|---|---|---|---|---|---|---|
| 2 | 8.86 | BUY | 2 | 8.87 | BUY | |
| 3 | 8.85 | BUY | 3 | 8.88 | BUY | |
| 5 | 8.88 | BUY | 5 | 8.91 | SELL | |
| 8 | 9.00 | SELL | 8 | 8.96 | SELL | |
| 13 | 9.08 | SELL | 13 | 9.04 | SELL | |
| 21 | 9.17 | SELL | 21 | 9.11 | SELL | |
| 34 | 9.24 | SELL | 34 | 9.17 | SELL | |
| 55 | 9.21 | SELL | 55 | 9.22 | SELL | |
| 90 | 9.37 | SELL | 90 | 9.28 | SELL | |
| 200 | 9.37 | SELL | 200 | 9.55 | SELL |
Amcor Plc
IPO: 2019-06-11
Ticker: AMCRIndices: S&P 500,
Exchange: New York Stock Exchange, Inc. (GB - USD)
Website: https://www.amcor.com/
Phone:
Common Stock
Manufacturing (
Miscellaneous Manufacturing Industries

 Click to Enlarge