| Date | Price $ | Result % | Candle Name | Side |
|---|---|---|---|---|
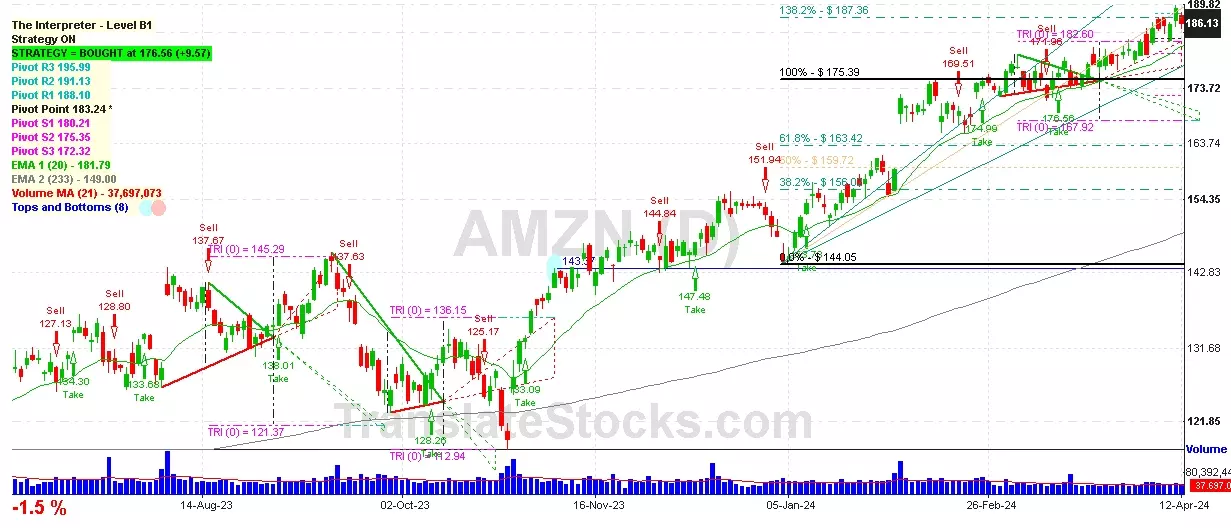
| 001 02 Apr 2024 | Sell Price: 180.69 | Profit: Open Day1 ($ 179.90) | Abandoned Baby | Sell |
| 002 26 Feb 2024 | Sell Price: 174.73 | Profit: Open Day1 ($ 174.08) | Dark Cloud Cover | Sell |
| 003 12 Jan 2024 | Sell Price: 154.62 | Profit: Open Day1 ($ 153.53) | Engulfing | Sell |
| 004 05 Sep 2023 | Sell Price: 137.27 | Profit: Open Day1 ($ 136.32) | Abandoned Baby | Sell |
| 005 22 Aug 2023 | Sell Price: 134.25 | Profit: Close Day2 ($ 131.84) | Dark Cloud Cover | Sell |
| 006 03 Aug 2023 | Buy Price: 128.91 | Profit: Open Day1 ($ 141.06) | Piercing Line | Buy |
| 007 07 Jul 2023 | Buy Price: 129.78 | Loss: Close Day2 ($ 128.78) | Abandoned Baby | Buy |
| 008 31 May 2023 | Sell Price: 120.58 | Loss: Close Day2 ($ 124.25) | Abandoned Baby | Sell |
| 009 24 May 2023 | Buy Price: 116.75 | Profit: Close Day2 ($ 120.11) | Abandoned Baby | Buy |
| 010One Year Average | Both Sides Result for 9 Signals |
Profit: $ 16.74 ($ 1.86 / Signal) |
All of Them | Buy + Sell |
| Simple Moving Averages (SMA) Period | Value $ | Signal | Exponential Moving Averages (EMA) Period | Value $ | Signal | |
|---|---|---|---|---|---|---|
| 2 | 184.88 | SELL | 2 | 184.66 | SELL | |
| 3 | 186.27 | SELL | 3 | 185.15 | SELL | |
| 5 | 186.08 | SELL | 5 | 185.28 | SELL | |
| 8 | 185.09 | SELL | 8 | 184.77 | SELL | |
| 13 | 183.46 | BUY | 13 | 183.58 | BUY | |
| 21 | 181.09 | BUY | 21 | 181.74 | BUY | |
| 34 | 178.96 | BUY | 34 | 178.85 | BUY | |
| 55 | 174.83 | BUY | 55 | 174.24 | BUY | |
| 90 | 165.69 | BUY | 90 | 167.41 | BUY | |
| 200 | 148.69 | BUY | 200 | 178.78 | BUY |
Amazon.com Inc
IPO: 1997-05-15
Ticker: AMZNIndices: S&P 500,
Nasdaq 100,
Exchange: Nasdaq Nms - Global Market (US - USD)
Website: https://www.amazon.com/
Phone:
Common Stock
Trade & Services (
Retail-catalog & Mail-order Houses
Year | 2021 | 2020 | 2019 | 2018 | 2017 | 2016 | 2015 | 2014 | 2013 | 2012 | 2011 | 2010 | 2009 | 2008 | 2007 | 2006 | |
|---|---|---|---|---|---|---|---|---|---|---|---|---|---|---|---|---|---|
| 1 | Assets + | 420,549 | 321,195 | 225,248 | 162,648 | 131,310 | 83,402 | 65,444 | 54,505 | 40,159 | 32,555 | 25,278 | 18,797 | 13,813 | 8,314 | 2,539 | 1,022 |
| 2 | Cash and Cash Equivalents + | 36,220 | 42,122 | 36,092 | 31,750 | 20,522 | 19,334 | 15,890 | 14,557 | 8,658 | 8,084 | 5,269 | 3,777 | 3,444 | 2,769 | 2,539 | 1,022 |
| 3 | Property + | 0 | 0 | 72,705 | 61,797 | 48,866 | 29,114 | 21,838 | 16,967 | 10,949 | 7,060 | 4,417 | 2,414 | 1,290 | 854 | 0 | 0 |
| 4 | Property + | 0 | 0 | 119,680 | 95,770 | 68,573 | 42,441 | 30,053 | 22,730 | 14,809 | 9,582 | 5,786 | 3,256 | 1,915 | 0 | 0 | 0 |
| 5 | Intangible Assets + | 5,107 | 4,981 | 4,049 | 4,110 | 3,371 | 854 | 762 | 764 | 645 | 725 | 647 | 563 | 567 | 0 | 0 | 0 |
| 6 | Finite-Lived Intangible Assets + | 3,960 | 3,838 | 4,021 | 4,088 | 3,362 | 854 | 762 | 764 | 645 | 725 | 647 | 563 | 567 | 0 | 0 | 0 |
| 7 | Liabilities and Equity + | 420,549 | 321,195 | 225,248 | 162,648 | 131,310 | 83,402 | 65,444 | 54,505 | 40,159 | 32,555 | 25,278 | 18,797 | 13,813 | 8,314 | 1,197 | 431 |
| 8 | Liabilities + | 142,266 | 126,385 | 87,812 | 68,391 | 57,883 | 43,816 | 33,899 | 28,089 | 22,980 | 19,002 | 17,521 | 11,933 | 7,364 | 4,746 | 0 | 0 |
| 9 | Stockholders' Equity + | 138,245 | 93,404 | 62,060 | 43,549 | 27,709 | 19,285 | 13,384 | 10,741 | 9,746 | 8,192 | 7,757 | 6,864 | 5,257 | 2,672 | 1,197 | 431 |
| 10 | Stockholders' Equity Attributable to Parent + | 138,245 | 93,404 | 62,060 | 43,549 | 27,709 | 19,285 | 13,384 | 10,741 | 9,746 | 8,192 | 7,757 | 6,864 | 5,257 | 2,672 | 1,197 | 431 |
| 11 | Stockholders' Equity + | 0.02 | 0.02 | 0.02 | 0.02 | 0.02 | 0.02 | 0.02 | 0.02 | 0.02 | 0.02 | 0.02 | 0.02 | 0.02 | 0.02 | 0 | 0 |
| 12 | Preferred Stock + | 0.01 | 0.01 | 0.01 | 0.01 | 0.01 | 0.01 | 0.01 | 0.01 | 0.01 | 0.01 | 0.01 | 0.01 | 0.01 | 0.01 | 0 | 0 |
| 13 | Common Stock + | 0.01 | 0.01 | 0.01 | 0.01 | 0.01 | 0.01 | 0.01 | 0.01 | 0.01 | 0.01 | 0.01 | 0.01 | 0.01 | 0.01 | 0 | 0 |
| 14 | Partners' Capital + | 85,915 | 52,551 | 31,220 | 19,625 | 8,636 | 4,916 | 2,545 | 1,949 | 2,190 | 1,916 | 1,955 | 1,324 | 172 | -730 | 0 | 0 |
| 15 | Partners' Capital + | 85,915 | 52,551 | 31,220 | 19,625 | 8,636 | 4,916 | 2,545 | 1,949 | 2,190 | 1,916 | 1,955 | 1,324 | 172 | -730 | 0 | 0 |
| 16 | Limited Liability Company (LLC) Members' Equity + | 84,539 | 52,371 | 30,234 | 18,590 | 8,152 | 3,931 | 1,822 | 1,438 | 2,005 | 1,677 | 1,639 | 1,134 | 116 | -853 | 0 | 0 |
| 17 | Limited Liability Company (LLC) Members' Equity + | 84,539 | 52,371 | 30,234 | 18,590 | 8,152 | 3,931 | 1,822 | 1,438 | 2,005 | 1,677 | 1,639 | 1,134 | 116 | -853 | 0 | 0 |
| 18 | Current Assets + | 161,580 | 132,733 | 96,334 | 75,101 | 60,197 | 45,781 | 36,474 | 31,327 | 24,625 | 21,296 | 17,490 | 13,747 | 9,797 | 6,157 | 0 | 0 |
| 19 | Cash + | 60,071 | 43,149 | 19,923 | 10,075 | 11,864 | 25,981 | 19,808 | 17,416 | 12,447 | 3,364 | 4,307 | 4,985 | 2,922 | 958 | 0 | 0 |
| 20 | Current Receivables + | 32,891 | 24,542 | 20,816 | 16,677 | 13,164 | 8,339 | 6,423 | 5,612 | 4,767 | 3,817 | 2,571 | 1,587 | 988 | 827 | 0 | 0 |
| 21 | Inventory + | 32,640 | 23,795 | 20,497 | 17,174 | 16,047 | 11,461 | 10,243 | 8,299 | 7,411 | 6,031 | 4,992 | 3,202 | 2,171 | 1,399 | 0 | 0 |
| 22 | Long-Term Assets + | 98,688 | 143,448 | 113,609 | 25,750 | 22,247 | 8,507 | 7,132 | 6,211 | 4,585 | 4,199 | 3,343 | 2,614 | 2,708 | 1,158 | 0 | 0 |
| 23 | Long-Term Restricted Cash and Investments + | 15 | 22 | 42 | 5 | 5 | 0 | 0 | 0 | 0 | 0 | 0 | 0 | 0 | 0 | 0 | 0 |
| 24 | Current Liabilities + | 142,266 | 126,385 | 87,812 | 68,391 | 57,883 | 43,816 | 33,899 | 28,089 | 22,980 | 19,002 | 14,896 | 10,372 | 7,364 | 4,746 | 0 | 0 |
| 25 | Long-Term Liabilities + | 91,294 | 69,590 | 51,962 | 52,198 | 46,708 | 20,693 | 18,568 | 15,675 | 7,433 | 5,361 | 2,625 | 1,561 | 1,192 | 896 | 0 | 0 |
| 26 | Increase (Decrease) in Stockholders' Equity [Roll Forward] + | -1,837 | -1,837 | -1,837 | -1,837 | -1,837 | -1,837 | -1,837 | -1,837 | -1,837 | -1,837 | -877 | -600 | -600 | -600 | 0 | 0 |
| 27 | Treasury Stock Transactions + | -1,837 | -1,837 | -1,837 | -1,837 | -1,837 | -1,837 | -1,837 | -1,837 | -1,837 | -1,837 | -877 | -600 | -600 | -600 | 0 | 0 |
| 28 | Treasury Stock + | -1,837 | -1,837 | -1,837 | -1,837 | -1,837 | -1,837 | -1,837 | -1,837 | -1,837 | -1,837 | -877 | -600 | -600 | -600 | 0 | 0 |
| 29 | Total Current Assets + | 161,580 | 132,733 | 96,334 | 75,101 | 60,197 | 45,781 | 36,474 | 31,327 | 24,625 | 21,296 | 17,490 | 13,747 | 9,797 | 6,157 | 0 | 0 |
| 30 | Operating Lease + | 56,082 | 37,553 | 25,141 | 0 | 0 | 0 | 0 | 0 | 0 | 0 | 0 | 0 | 0 | 0 | 0 | 0 |
| 31 | Finance Lease + | 0 | 105,653 | 82,541 | 0 | 0 | 0 | 0 | 0 | 0 | 0 | 0 | 0 | 0 | 0 | 0 | 0 |
| 32 | Goodwill + | 71,453 | 120,670 | 14,754 | 14,548 | 13,350 | 3,784 | 3,759 | 3,319 | 2,655 | 2,552 | 1,955 | 1,349 | 1,234 | 438 | 0 | 0 |
| 33 | Long-Term Other Assets + | 27,235 | 22,778 | 16,314 | 11,202 | 8,897 | 4,723 | 3,373 | 2,892 | 1,930 | 1,647 | 1,388 | 1,265 | 1,474 | 1,158 | 0 | 0 |
| 34 | Total Assets + | 420,549 | 321,195 | 225,248 | 162,648 | 131,310 | 83,402 | 65,444 | 54,505 | 40,159 | 32,555 | 25,278 | 18,797 | 13,813 | 8,314 | 0 | 0 |
| 35 | Total Liabilities and Equity + | 420,549 | 321,195 | 225,248 | 162,648 | 131,310 | 83,402 | 65,444 | 54,505 | 40,159 | 32,555 | 25,278 | 18,797 | 13,813 | 8,314 | 0 | 0 |
Year | 2021 | 2020 | 2019 | 2018 | 2017 | 2016 | 2015 | 2014 | 2013 | 2012 | 2011 | 2010 | 2009 | 2008 | 2007 | |
|---|---|---|---|---|---|---|---|---|---|---|---|---|---|---|---|---|
| 1 | -272,344 | -233,307 | -165,536 | -139,156 | -111,934 | -88,265 | -71,651 | -62,752 | -54,181 | -45,971 | -37,288 | -26,561 | -18,978 | -14,896 | -11,482 | |
| 2 | 0 | 0 | 0 | 0 | 0 | 0 | 0 | 0 | 0 | 0 | 0 | 0 | 5,531 | 4,270 | 3,353 | |
| 3 | 0 | 0 | 0 | 0 | 0 | 8,116 | 6,281 | 4,746 | 3,253 | 2,159 | 1,083 | 568 | 378 | 287 | 246 | |
| 4 | 0 | 0 | 201 | 296 | 214 | 167 | 171 | 133 | 114 | 159 | 154 | 106 | 102 | -24 | 9 | |
| 5 | 8,823 | 6,668 | 5,203 | 4,336 | 3,674 | 2,432 | 1,747 | 1,552 | 1,129 | 896 | 658 | 470 | 328 | 279 | 235 | |
| 6 | 1,000 | 1,400 | 1,000 | 878 | 626 | 451 | 289 | 225 | 172 | 136 | 87 | 0 | 0 | 0 | 0 | |
| 7 | 0 | 0 | 0 | 0 | 0 | 0 | 0 | 0 | 0 | 0 | 0 | 0 | 0 | 53 | 0 | |
| 8 | 0 | 0 | 0 | 0 | 0 | 0 | 0 | 0 | 0 | 0 | 0 | 0 | -4,402 | -3,428 | -2,698 | |
| 9 | 24,879 | 22,899 | 14,541 | 12,421 | 4,106 | 4,186 | 2,233 | 178 | 745 | 676 | 862 | 1,406 | 1,129 | 842 | 655 | |
| 10 | 448 | 555 | 832 | 440 | 202 | 100 | 50 | 39 | 38 | 40 | 61 | 51 | 37 | 83 | 90 | |
| 11 | -55 | 35 | -20 | -206 | 247 | 62 | -215 | -98 | -84 | -95 | 70 | -70 | 5 | 23 | 0 | |
| 12 | 14,633 | 2,371 | 203 | -183 | 346 | 90 | -256 | -118 | -136 | -80 | 76 | 79 | 29 | 47 | -8 | |
| 13 | 13,272 | 1,279 | -565 | -1,160 | -300 | -294 | -665 | -289 | -239 | -132 | 72 | 91 | 32 | 59 | 5 | |
| 14 | 473 | 617 | 695 | 0 | 0 | 0 | 0 | 0 | 0 | 0 | 0 | 0 | 0 | 0 | 0 | |
| 15 | 1,809 | 1,647 | 1,600 | 1,417 | 848 | 484 | 459 | 210 | 141 | 92 | 65 | 39 | 34 | 71 | 77 | |
| 16 | 38,151 | 24,178 | 13,976 | 11,261 | 3,806 | 3,892 | 1,568 | -111 | 506 | 544 | 934 | 1,497 | 1,161 | 901 | 660 | |
| 17 | 4 | 16 | -14 | 9 | -4 | -96 | -22 | 37 | -71 | -155 | -12 | 7 | -6 | -9 | 0 | |
| 18 | -4,791 | -2,863 | -2,374 | -1,197 | -769 | -1,425 | -950 | -167 | -161 | -428 | -291 | -352 | -253 | -247 | -184 | |
| 19 | Total Net Income (Loss) Attributable to Parent + | 33,364 | 21,331 | 11,588 | 10,073 | 3,033 | 2,371 | 596 | -241 | 274 | -39 | 631 | 1,152 | 902 | 645 | 476 |
| 20 | Total Earnings Per Share + | 65.96 | 42.64 | 23.46 | 20.68 | 6.32 | 5.01 | 1.28 | -0.52 | 0.60 | -0.09 | 1.39 | 2.58 | 2.08 | 1.52 | 1.15 |
| 21 | Total Earnings Per Share + | 64.81 | 41.83 | 23.01 | 20.14 | 6.15 | 4.90 | 1.25 | -0.52 | 0.59 | -0.09 | 1.37 | 2.53 | 2.04 | 1.49 | 1.12 |

 Click to Enlarge