| Date | Price $ | Result % | Candle Name | Side | No Candlesticks to Show Yet. |
|---|
| Simple Moving Averages (SMA) Period | Value $ | Signal | Exponential Moving Averages (EMA) Period | Value $ | Signal | |
|---|---|---|---|---|---|---|
| 2 | 486.00 | BUY | 2 | 487.91 | BUY | |
| 3 | 488.11 | BUY | 3 | 488.69 | SELL | |
| 5 | 490.19 | SELL | 5 | 490.49 | SELL | |
| 8 | 496.06 | SELL | 8 | 491.75 | SELL | |
| 13 | 494.60 | SELL | 13 | 491.35 | SELL | |
| 21 | 488.83 | SELL | 21 | 489.16 | SELL | |
| 34 | 482.30 | BUY | 34 | 486.49 | BUY | |
| 55 | 479.39 | BUY | 55 | 484.67 | BUY | |
| 90 | 485.31 | BUY | 90 | 482.14 | BUY | |
| 200 | 470.31 | BUY | 200 | 464.63 | BUY |
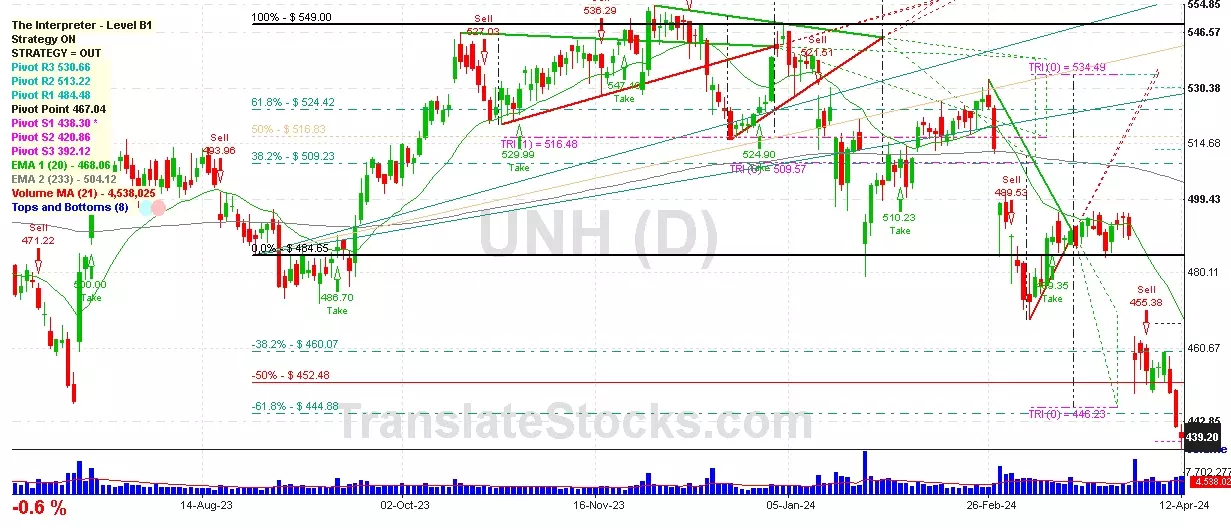
Anthem Inc
IPO: 2001-10-30
Ticker: ANTMIndices: S&P 500,
Exchange: New York Stock Exchange, Inc. (US - USD)
Website: https://www.antheminc.com/
Phone:
Common Stock
Finance (
Hospital & Medical Service Plans

 Click to Enlarge