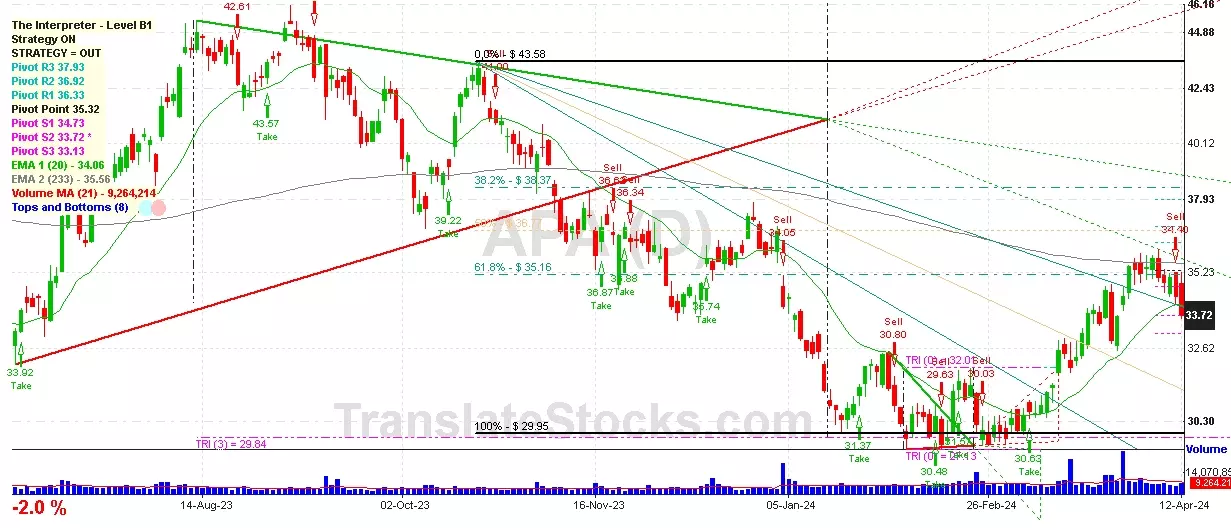
Hey Friend, I'm analysing APA CORP (APA), and it is between the Support of $ 33.72 (PivotS2) and the Resistance of $ 34.73 (PivotS1). The stock is also approaching the line of PivotS2 at $ 33.72, and if it goes below this line it could reach the next Support of Triangle projection at $32.01. Since it is nailed exactly on the line of $ 33.72, we should wait for another day to better understand which side the stock will move to.

| Date | Price $ | Result % | Candle Name | Side |
|---|---|---|---|---|
| 001 26 Mar 2024 | Sell Price: 32.88 | Profit: Open Day1 ($ 32.73) | Engulfing | Sell |
| 002 07 Mar 2024 | Sell Price: 30.55 | Loss: Close Day2 ($ 31.20) | Abandoned Baby | Sell |
| 003 04 Mar 2024 | Sell Price: 30.03 | Loss: Close Day2 ($ 30.63) | Engulfing | Sell |
| 004 29 Jan 2024 | Sell Price: 31.87 | Profit: Open Day1 ($ 31.45) | Abandoned Baby | Sell |
| 005One Year Average | Both Sides Result for 4 Signals |
Loss: $ -0.68 ($ -0.17 / Signal) |
All of Them | Buy + Sell |
| Simple Moving Averages (SMA) Period | Value $ | Signal | Exponential Moving Averages (EMA) Period | Value $ | Signal | |
|---|---|---|---|---|---|---|
| 2 | 32.06 | SELL | 2 | 32.10 | SELL | |
| 3 | 32.19 | SELL | 3 | 32.16 | SELL | |
| 5 | 32.27 | SELL | 5 | 32.31 | SELL | |
| 8 | 32.41 | SELL | 8 | 32.59 | SELL | |
| 13 | 33.26 | SELL | 13 | 32.95 | SELL | |
| 21 | 33.83 | SELL | 21 | 33.13 | SELL | |
| 34 | 33.32 | SELL | 34 | 33.05 | SELL | |
| 55 | 32.19 | SELL | 55 | 33.01 | SELL | |
| 90 | 32.66 | SELL | 90 | 33.45 | SELL | |
| 200 | 36.71 | SELL | 200 | 35.09 | SELL |
Apa Corp
IPO: 1969-05-27
Ticker: APAIndices: S&P 500,
Exchange: Nasdaq Nms - Global Market (US - USD)
Common Stock
Energy & Transportation (
Crude Petroleum & Natural Gas
 Click to Enlarge