
| Date | Price $ | Result % | Candle Name | Side |
|---|---|---|---|---|
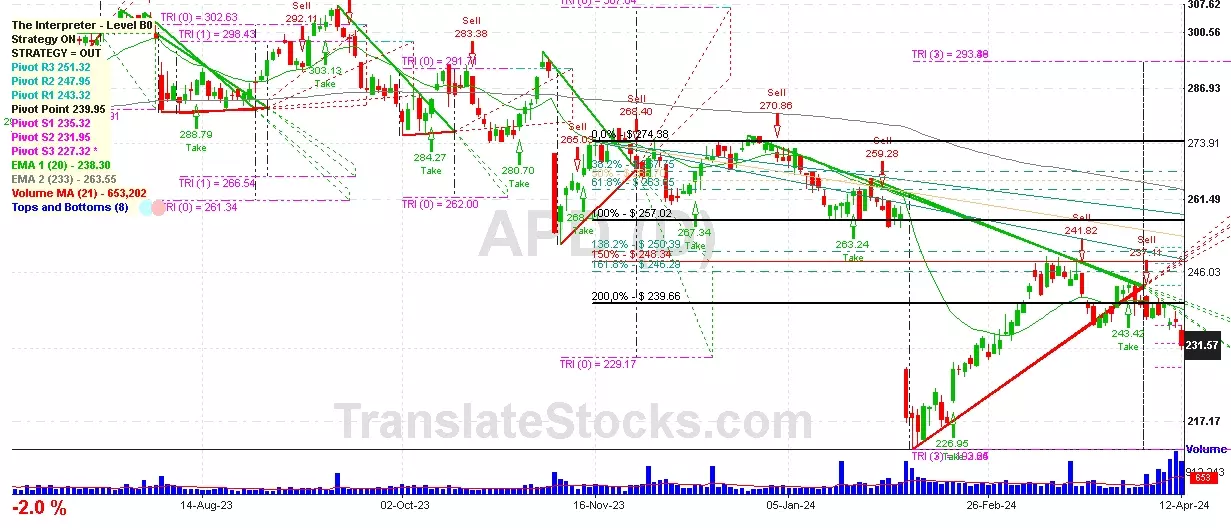
| 001 11 Apr 2024 | Buy Price: 236.25 | Loss: Close Day2 ($ 231.29) | Abandoned Baby | Buy |
| 002 19 Mar 2024 | Sell Price: 241.82 | Profit: Open Day1 ($ 239.80) | Engulfing | Sell |
| 003 22 Nov 2023 | Sell Price: 274.27 | Profit: Open Day2 ($ 273.70) | Dark Cloud Cover | Sell |
| 004 03 Oct 2023 | Buy Price: 281.79 | Profit: Open Day1 ($ 284.87) | Engulfing | Buy |
| 005 29 Sep 2023 | Sell Price: 283.40 | Profit: Open Day1 ($ 281.33) | Engulfing | Sell |
| 006 15 Sep 2023 | Sell Price: 302.11 | Profit: Open Day1 ($ 301.63) | Engulfing | Sell |
| 007 23 Aug 2023 | Buy Price: 285.75 | Profit: Close Day1 ($ 286.63) | Piercing Line | Buy |
| 008 19 Jul 2023 | Buy Price: 298.59 | Profit: Open Day1 ($ 300.31) | Piercing Line | Buy |
| 009 20 Jun 2023 | Sell Price: 289.30 | Profit: Open Day1 ($ 287.69) | Abandoned Baby | Sell |
| 010 07 Jun 2023 | Buy Price: 282.42 | Profit: Close Day1 ($ 283.38) | Engulfing | Buy |
| 011 04 May 2023 | Sell Price: 291.07 | Loss: Close Day2 ($ 295.56) | Engulfing | Sell |
| 012One Year Average | Both Sides Result for 11 Signals |
Profit: $ 3.94 ($ 0.36 / Signal) |
All of Them | Buy + Sell |
| Simple Moving Averages (SMA) Period | Value $ | Signal | Exponential Moving Averages (EMA) Period | Value $ | Signal | |
|---|---|---|---|---|---|---|
| 2 | 231.02 | BUY | 2 | 231.71 | BUY | |
| 3 | 229.93 | BUY | 3 | 231.34 | BUY | |
| 5 | 230.50 | BUY | 5 | 231.67 | BUY | |
| 8 | 233.04 | SELL | 8 | 232.75 | BUY | |
| 13 | 235.17 | SELL | 13 | 234.32 | SELL | |
| 21 | 236.79 | SELL | 21 | 235.84 | SELL | |
| 34 | 239.23 | SELL | 34 | 237.52 | SELL | |
| 55 | 235.59 | SELL | 55 | 240.79 | SELL | |
| 90 | 247.87 | SELL | 90 | 246.96 | SELL | |
| 200 | 268.75 | SELL | 200 | 260.13 | SELL |
Air Products & Chemicals Inc
IPO: 1961-11-13
Ticker: APDIndices: S&P 500,
Exchange: New York Stock Exchange, Inc. (US - USD)
Website: http://www.airproducts.com/
Phone:
Common Stock
Life Sciences (
Industrial Inorganic Chemicals

 Click to Enlarge