
| Date | Price $ | Result % | Candle Name | Side |
|---|---|---|---|---|
| 001 03 Apr 2024 | Buy Price: 77.57 | Profit: Open Day1 ($ 78.42) | Engulfing | Buy |
| 002 03 Apr 2024 | Buy Price: 77.49 | Profit: Open Day1 ($ 78.42) | Piercing Line | Buy |
| 003 01 Apr 2024 | Sell Price: 78.79 | Profit: Open Day1 ($ 77.51) | Engulfing | Sell |
| 004 06 Mar 2024 | Sell Price: 78.13 | Loss: Close Day2 ($ 78.20) | Dark Cloud Cover | Sell |
| 005 05 Mar 2024 | Buy Price: 79.43 | Profit: Open Day1 ($ 80.13) | Engulfing | Buy |
| 006 01 Mar 2024 | Sell Price: 79.05 | Profit: Open Day1 ($ 78.92) | Engulfing | Sell |
| 007 26 Feb 2024 | Buy Price: 77.52 | Profit: Open Day1 ($ 78.40) | Piercing Line | Buy |
| 008 22 Jan 2024 | Buy Price: 80.00 | Profit: Open Day1 ($ 81.61) | Abandoned Baby | Buy |
| 009 01 Nov 2023 | Sell Price: 86.08 | Profit: Open Day1 ($ 78.26) | Engulfing | Sell |
| 010 19 Sep 2023 | Buy Price: 102.57 | Profit: Open Day1 ($ 103.32) | Engulfing | Buy |
| 011 03 Aug 2023 | Buy Price: 109.58 | Profit: Open Day1 ($ 110.72) | Abandoned Baby | Buy |
| 012 29 Jun 2023 | Sell Price: 100.89 | Loss: Close Day2 ($ 103.03) | Dark Cloud Cover | Sell |
| 013 30 May 2023 | Sell Price: 91.23 | Profit: Open Day1 ($ 90.02) | Dark Cloud Cover | Sell |
| 014 19 May 2023 | Sell Price: 94.37 | Profit: Open Day2 ($ 93.74) | Dark Cloud Cover | Sell |
| 015 10 May 2023 | Buy Price: 94.91 | Loss: Close Day2 ($ 92.69) | Abandoned Baby | Buy |
| 016One Year Average | Both Sides Result for 15 Signals |
Profit: $ 13.50 ($ 0.90 / Signal) |
All of Them | Buy + Sell |
| Simple Moving Averages (SMA) Period | Value $ | Signal | Exponential Moving Averages (EMA) Period | Value $ | Signal | |
|---|---|---|---|---|---|---|
| 2 | 70.17 | BUY | 2 | 70.14 | BUY | |
| 3 | 69.99 | BUY | 3 | 70.13 | BUY | |
| 5 | 69.73 | BUY | 5 | 70.43 | SELL | |
| 8 | 70.97 | SELL | 8 | 71.19 | SELL | |
| 13 | 72.94 | SELL | 13 | 72.41 | SELL | |
| 21 | 74.81 | SELL | 21 | 73.83 | SELL | |
| 34 | 76.19 | SELL | 34 | 75.37 | SELL | |
| 55 | 77.54 | SELL | 55 | 77.13 | SELL | |
| 90 | 80.38 | SELL | 90 | 79.58 | SELL | |
| 200 | 88.47 | SELL | 200 | 85.93 | SELL |
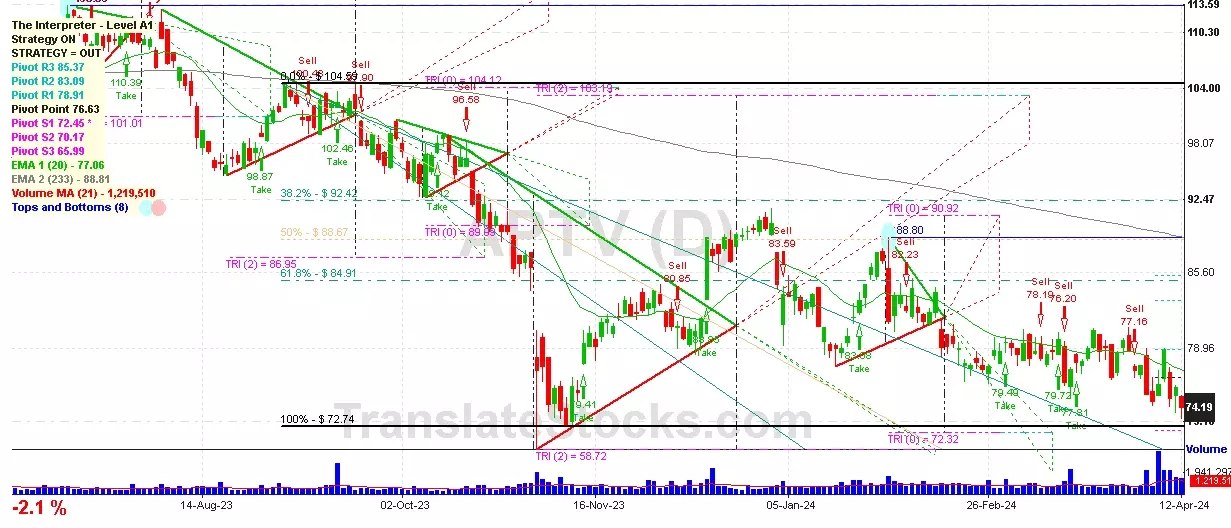
Aptiv Plc
IPO: 2011-11-17
Ticker: APTVIndices: S&P 500,
Exchange: New York Stock Exchange, Inc. (IE - USD)
Website: https://www.aptiv.com
Phone:
Common Stock
Manufacturing (
Motor Vehicle Parts & Accessories

 Click to Enlarge