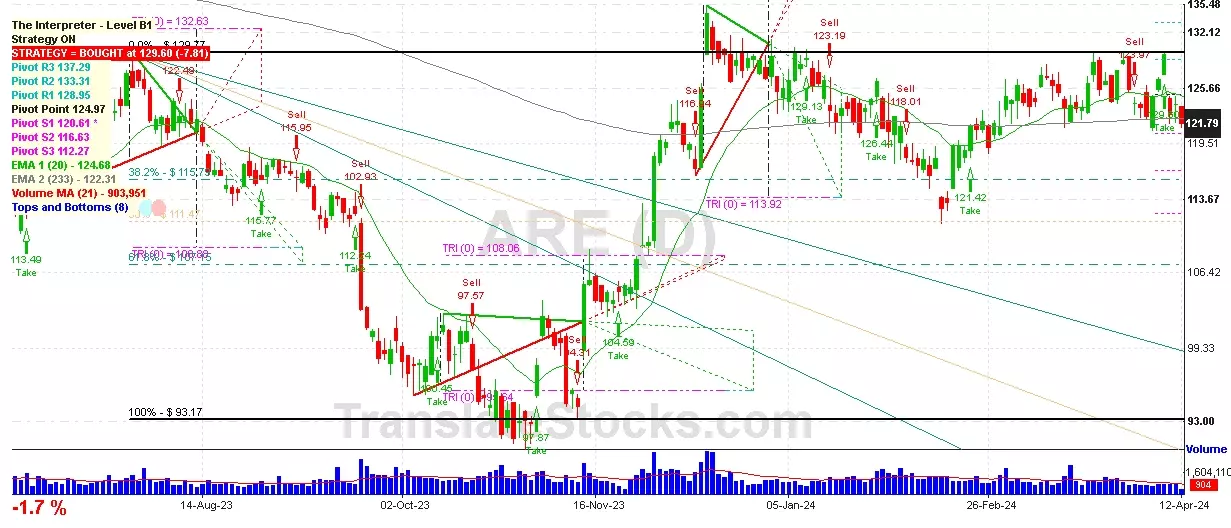
Hey Friend, I'm analysing ALEXANDRIA REAL ESTATE EQUIT (ARE), and it is between the Support of $ 120.61 (PivotS1) and the Resistance of $ 123.52 (Triangle Projection Level 0). The stock is also approaching the line of PivotS1 at $ 120.61, and if it goes below this line it could reach the next Support of 38.2% of Fibonacci at $ 115.79.

| Date | Price $ | Result % | Candle Name | Side |
|---|---|---|---|---|
| 001 01 Apr 2024 | Sell Price: 125.50 | Profit: Open Day1 ($ 123.93) | Engulfing | Sell |
| 002 22 Mar 2024 | Sell Price: 125.53 | Profit: Close Day2 ($ 124.19) | Engulfing | Sell |
| 003 08 Feb 2024 | Buy Price: 117.90 | Profit: Close Day2 ($ 117.95) | Piercing Line | Buy |
| 004 14 Nov 2023 | Buy Price: 105.32 | Profit: Close Day1 ($ 105.71) | Abandoned Baby | Buy |
| 005 12 Jul 2023 | Sell Price: 117.76 | Loss: Close Day2 ($ 119.54) | Dark Cloud Cover | Sell |
| 006One Year Average | Both Sides Result for 5 Signals |
Profit: $ 1.57 ($ 0.31 / Signal) |
All of Them | Buy + Sell |
| Simple Moving Averages (SMA) Period | Value $ | Signal | Exponential Moving Averages (EMA) Period | Value $ | Signal | |
|---|---|---|---|---|---|---|
| 2 | 116.48 | BUY | 2 | 116.66 | SELL | |
| 3 | 116.65 | SELL | 3 | 117.12 | SELL | |
| 5 | 118.19 | SELL | 5 | 118.25 | SELL | |
| 8 | 120.90 | SELL | 8 | 119.68 | SELL | |
| 13 | 122.19 | SELL | 13 | 121.17 | SELL | |
| 21 | 123.88 | SELL | 21 | 122.28 | SELL | |
| 34 | 124.21 | SELL | 34 | 122.78 | SELL | |
| 55 | 122.32 | SELL | 55 | 122.47 | SELL | |
| 90 | 123.69 | SELL | 90 | 121.20 | SELL | |
| 200 | 116.07 | BUY | 200 | 120.96 | SELL |
Alexandria Real Estate Equit
IPO: 1997-05-28
Ticker: AREIndices: S&P 500,
Exchange: New York Stock Exchange, Inc. (US - USD)
Website: http://www.are.com
Phone:
REIT (Real Estate Investment Trust)
Real Estate & Construction (
Real Estate Investment Trusts
 Click to Enlarge