| Date | Price $ | Result % | Candle Name | Side |
|---|---|---|---|---|
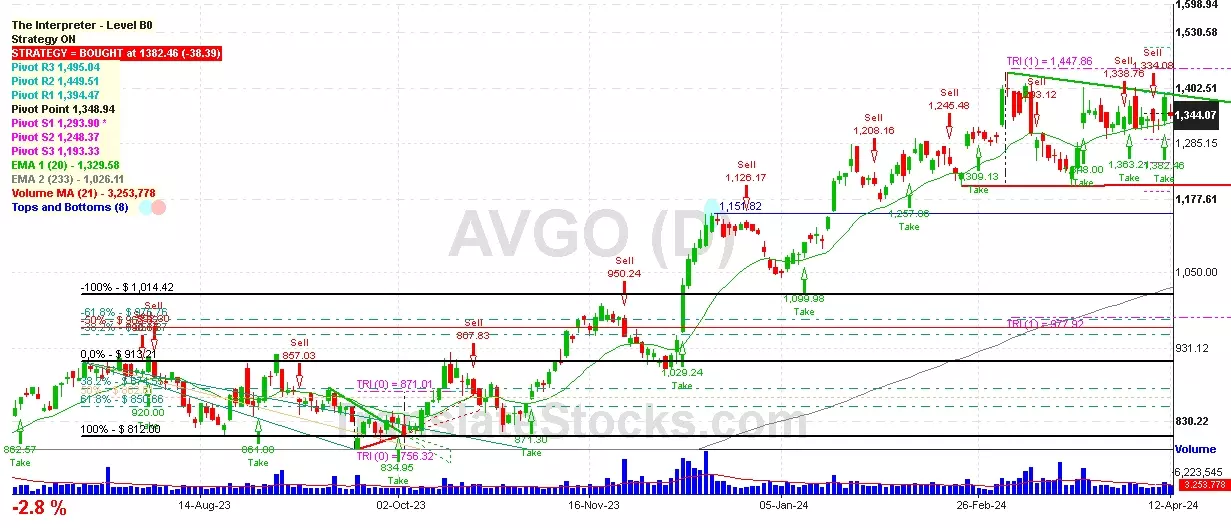
| 001 05 Mar 2024 | Sell Price: 1,342.75 | Loss: Close Day2 ($ 1,407.01) | Abandoned Baby | Sell |
| 002 18 Jan 2024 | Buy Price: 1,143.91 | Profit: Open Day1 ($ 1,157.31) | Abandoned Baby | Buy |
| 003 17 Jan 2024 | Sell Price: 1,103.67 | Loss: Close Day2 ($ 1,211.20) | Abandoned Baby | Sell |
| 004 27 Dec 2023 | Sell Price: 1,126.05 | Profit: Close Day1 ($ 1,122.41) | Engulfing | Sell |
| 005 27 Dec 2023 | Sell Price: 1,126.17 | Profit: Close Day1 ($ 1,122.41) | Dark Cloud Cover | Sell |
| 006 06 Sep 2023 | Buy Price: 872.27 | Loss: Close Day2 ($ 857.55) | Abandoned Baby | Buy |
| 007 24 Aug 2023 | Sell Price: 855.25 | Profit: Close Day1 ($ 851.82) | Engulfing | Sell |
| 008 24 Aug 2023 | Sell Price: 854.46 | Profit: Close Day1 ($ 851.82) | Dark Cloud Cover | Sell |
| 009 17 Jul 2023 | Buy Price: 910.35 | Loss: Close Day2 ($ 901.37) | Abandoned Baby | Buy |
| 010 05 Jul 2023 | Sell Price: 861.86 | Profit: Open Day1 ($ 845.00) | Abandoned Baby | Sell |
| 011One Year Average | Both Sides Result for 10 Signals |
Loss: $ -151.76 ($ -15.18 / Signal) |
All of Them | Buy + Sell |
| Simple Moving Averages (SMA) Period | Value $ | Signal | Exponential Moving Averages (EMA) Period | Value $ | Signal | |
|---|---|---|---|---|---|---|
| 2 | 1,270.81 | SELL | 2 | 1,271.84 | SELL | |
| 3 | 1,290.23 | SELL | 3 | 1,282.57 | SELL | |
| 5 | 1,305.09 | SELL | 5 | 1,297.10 | SELL | |
| 8 | 1,320.54 | SELL | 8 | 1,308.71 | SELL | |
| 13 | 1,327.64 | SELL | 13 | 1,316.19 | SELL | |
| 21 | 1,329.25 | SELL | 21 | 1,317.18 | SELL | |
| 34 | 1,321.77 | SELL | 34 | 1,307.70 | SELL | |
| 55 | 1,297.55 | SELL | 55 | 1,278.79 | SELL | |
| 90 | 1,230.04 | BUY | 90 | 1,221.28 | BUY | |
| 200 | 1,037.88 | BUY | 200 | 1,070.20 | BUY |
Broadcom Inc
IPO: 2016-02-01
Ticker: AVGOIndices: S&P 500,
Nasdaq 100,
Exchange: Nasdaq Nms - Global Market (US - USD)
Website: https://www.broadcom.com
Phone:
Common Stock
Manufacturing (
Semiconductors & Related Devices
Year | 2021 | 2020 | 2019 | 2018 | 2017 | 2016 | |
|---|---|---|---|---|---|---|---|
| 1 | Assets + | 75,570 | 0 | 0 | 0 | 54,418 | 27,829 |
| 2 | Real Estate Investment Property + | 195 | 0 | 0 | 0 | 177 | 0 |
| 3 | Real Estate Investment Property + | 195 | 0 | 0 | 0 | 177 | 0 |
| 4 | Cash and Cash Equivalents + | 12,163 | 0 | 0 | 0 | 11,204 | 3,097 |
| 5 | Property + | 2,348 | 0 | 0 | 0 | 2,599 | 0 |
| 6 | Property + | 5,544 | 0 | 0 | 0 | 4,092 | 0 |
| 7 | Intangible Assets + | 11,374 | 0 | 0 | 0 | 10,832 | 0 |
| 8 | Finite-Lived Intangible Assets + | 11,347 | 0 | 0 | 0 | 10,120 | 0 |
| 9 | Liabilities and Equity + | 75,570 | 0 | 0 | 0 | 54,418 | 21,876 |
| 10 | Liabilities + | 50,581 | 0 | 0 | 0 | 31,232 | 0 |
| 11 | Stockholders' Equity + | 24,962 | 0 | 0 | 0 | 23,186 | 21,876 |
| 12 | Stockholders' Equity Attributable to Parent + | 25,078 | 0 | 0 | 0 | 20,285 | 0 |
| 13 | Stockholders' Equity + | 3,737 | 0 | 0 | 0 | 0 | 0 |
| 14 | Preferred Stock + | 3,737 | 0 | 0 | 0 | 0 | 0 |
| 15 | Common Stock + | 0 | 0 | 0 | 0 | 0 | 0 |
| 16 | Partners' Capital + | 748 | 0 | 0 | 0 | -129 | 0 |
| 17 | Partners' Capital + | 748 | 0 | 0 | 0 | -129 | 0 |
| 18 | Limited Liability Company (LLC) Members' Equity + | 632 | 0 | 0 | 0 | -220 | 0 |
| 19 | Limited Liability Company (LLC) Members' Equity + | 632 | 0 | 0 | 0 | -220 | 0 |
| 20 | Current Assets + | 16,586 | 0 | 0 | 0 | 15,823 | 0 |
| 21 | Current Receivables + | 2,071 | 0 | 0 | 0 | 31 | 0 |
| 22 | Inventory + | 1,297 | 0 | 0 | 0 | 1,447 | 0 |
| 23 | Current Prepaid Expense + | 539 | 0 | 0 | 0 | 440 | 0 |
| 24 | Long-Term Assets + | 45,905 | 0 | 0 | 0 | 25,164 | 24,732 |
| 25 | Current Liabilities + | 6,281 | 0 | 0 | 0 | 2,529 | 0 |
| 26 | Long-Term Other Undisclosed Liabilities | 38,941 | 0 | 0 | 0 | -9,998 | 0 |
| 27 | Long-Term Liabilities + | 44,300 | 0 | 0 | 0 | 28,703 | 0 |
| 28 | Current Other Assets + | 1,055 | 0 | 0 | 0 | 724 | 0 |
| 29 | Total Current Assets + | 16,586 | 0 | 0 | 0 | 15,823 | 0 |
| 30 | Operating Lease + | 588 | 0 | 0 | 0 | 0 | 0 |
| 31 | Finance Lease + | 643 | 0 | 0 | 0 | 0 | 0 |
| 32 | Goodwill + | 43,450 | 0 | 0 | 0 | 24,706 | 24,732 |
| 33 | Long-Term Other Assets + | 1,812 | 0 | 0 | 0 | 458 | 0 |
| 34 | Total Assets + | 75,570 | 0 | 0 | 0 | 54,418 | 0 |
| 35 | Total Liabilities + | 50,581 | 0 | 0 | 0 | 31,232 | 0 |
| 36 | Stockholders' Equity Attributable to Noncontrolling Interest + | 0 | 0 | 0 | 0 | 2,901 | 0 |
| 37 | Total Stockholders' Equity + | 24,962 | 0 | 0 | 0 | 23,186 | 21,876 |
| 38 | Total Liabilities and Equity + | 75,570 | 0 | 0 | 0 | 54,418 | 0 |
Year | 2021 | 2020 | 2019 | 2018 | 2017 | 2016 | |
|---|---|---|---|---|---|---|---|
| 1 | 27,450 | 0 | 0 | 0 | 0 | 0 | |
| 2 | 2,617 | 0 | 0 | 0 | 0 | 0 | |
| 3 | 13,600 | 0 | 0 | 0 | 0 | 0 | |
| 4 | 0 | 0 | 0 | 0 | 17,636 | 13,240 | |
| 5 | 0 | 0 | 0 | 0 | -9,127 | -7,300 | |
| 6 | -10,606 | 0 | 0 | 0 | -9,127 | 0 | |
| 7 | 16,844 | 0 | 0 | 0 | 8,509 | 5,940 | |
| 8 | 4,854 | 0 | 0 | 0 | 3,292 | 2,674 | |
| 9 | 148 | 0 | 0 | 0 | 161 | 996 | |
| 10 | 1,347 | 0 | 0 | 0 | 787 | 806 | |
| 11 | -8,325 | 0 | 0 | 0 | -6,126 | -6,349 | |
| 12 | 8,519 | 0 | 0 | 0 | 2,383 | -409 | |
| 13 | 99 | 0 | 0 | 0 | -1 | 0 | |
| 14 | 26 | 0 | 0 | 0 | 43 | 27 | |
| 15 | 16 | 0 | 0 | 0 | 18 | 0 | |
| 16 | 131 | 0 | 0 | 0 | 62 | 10 | |
| 17 | 1,885 | 0 | 0 | 0 | 454 | 585 | |
| 18 | 198 | 0 | 0 | 0 | 166 | 123 | |
| 19 | 0 | 0 | 0 | 0 | 1,825 | -1,107 | |
| 20 | 6,765 | 0 | 0 | 0 | 1,825 | -1,107 | |
| 21 | -29 | 0 | 0 | 0 | -35 | -642 | |
| 22 | 6,707 | 0 | 0 | 0 | 1,755 | -2,391 | |
| 23 | 0 | 0 | 0 | 0 | -6 | -112 | |
| 24 | 6,736 | 0 | 0 | 0 | 1,784 | -1,861 | |
| 25 | 0 | 0 | 0 | 0 | -92 | 122 | |
| 26 | Total Net Income (Loss) Attributable to Parent + | 0 | 0 | 0 | 0 | 1,692 | -1,739 |
| 27 | Preferred Stock Dividends + | 299 | 0 | 0 | 0 | 0 | 0 |
| 28 | 6,437 | 0 | 0 | 0 | 1,692 | 0 | |
| 29 | Income (Loss) from Continuing Operations + | 6,736 | 0 | 0 | 0 | 1,790 | -1,749 |
| 30 | Income (Loss) from Continuing Operations + | 0 | 0 | 0 | 0 | 1,882 | -1,865 |
| 31 | Total Income (Loss) from Continuing Operations + | 0 | 0 | 0 | 0 | 3,580 | -3,498 |
| 32 | Income (Loss) from Discontinued Operations + | 0 | 0 | 0 | 0 | -6 | -112 |
| 33 | Income (Loss) from Discontinued Operations + | 0 | 0 | 0 | 0 | 0 | -118 |
| 34 | Total Income (Loss) from Discontinued Operations + | 0 | 0 | 0 | 0 | -6 | -106 |
| 35 | Income (Loss) from Continuing Operations + | 15.70 | 0 | 0 | 0 | 4.19 | -4.46 |
| 36 | 0 | 0 | 0 | 0 | -0.01 | -0.29 | |
| 37 | Total Earnings Per Share + | 15.70 | 0 | 0 | 0 | 4.18 | -4.75 |
| 38 | Income (Loss) from Continuing Operations + | 15.70 | 0 | 0 | 0 | 4.19 | -4.46 |
| 39 | Income (Loss) from Continuing Operations + | 15 | 0 | 0 | 0 | 4.03 | -4.57 |
| 40 | 0 | 0 | 0 | 0 | -0.01 | -0.29 | |
| 41 | Total Earnings Per Share + | 15 | 0 | 0 | 0 | 4.02 | -4.86 |
| 42 | 0 | 0 | 0 | 0 | 4.08 | 0 | |
| 43 | 14.40 | 0 | 0 | 0 | 8.16 | 1.94 | |
| 44 | 94.40 | 0 | 0 | 0 | 0 | 0 |

 Click to Enlarge