
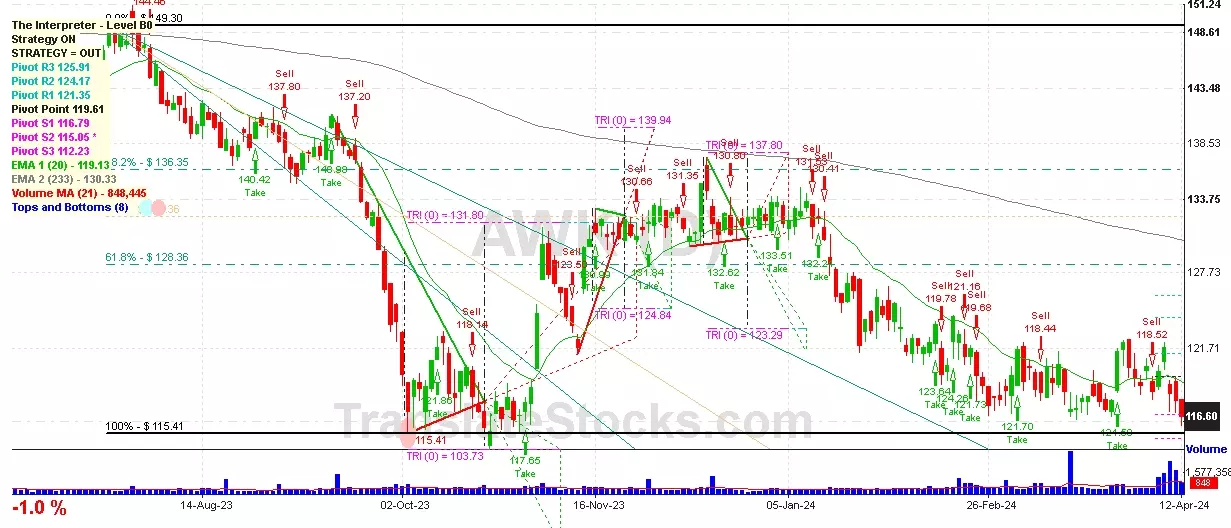
Hey Friend, I'm analysing AMERICAN WATER WORKS CO INC (AWK), and it is between the Support of $ 116.60 (100% of Fibonacci) and the Resistance of $ 116.79 (PivotS1). The stock is falling and may come close and reach $ 116.60 soon. Since it is nailed exactly on the line of $ 116.60, we should wait for another day to better understand which side the stock will move to.

| Date | Price $ | Result % | Candle Name | Side |
|---|---|---|---|---|
| 001 01 Apr 2024 | Sell Price: 120.30 | Profit: Open Day1 ($ 120.11) | Engulfing | Sell |
| 002 18 Mar 2024 | Buy Price: 117.23 | Profit: Open Day1 ($ 117.74) | Abandoned Baby | Buy |
| 003 25 Sep 2023 | Buy Price: 132.70 | Loss: Close Day2 ($ 126.32) | Piercing Line | Buy |
| 004 22 Aug 2023 | Buy Price: 138.40 | Profit: Open Day1 ($ 139.80) | Engulfing | Buy |
| 005 06 Jun 2023 | Sell Price: 144.79 | Profit: Open Day1 ($ 144.26) | Engulfing | Sell |
| 006 30 May 2023 | Sell Price: 143.20 | Loss: Close Day2 ($ 143.58) | Dark Cloud Cover | Sell |
| 007One Year Average | Both Sides Result for 6 Signals |
Loss: $ -4.13 ($ -0.69 / Signal) |
All of Them | Buy + Sell |
| Simple Moving Averages (SMA) Period | Value $ | Signal | Exponential Moving Averages (EMA) Period | Value $ | Signal | |
|---|---|---|---|---|---|---|
| 2 | 120.63 | BUY | 2 | 120.76 | BUY | |
| 3 | 120.17 | BUY | 3 | 120.25 | BUY | |
| 5 | 119.28 | BUY | 5 | 119.48 | BUY | |
| 8 | 117.70 | BUY | 8 | 118.89 | BUY | |
| 13 | 118.17 | BUY | 13 | 118.61 | BUY | |
| 21 | 118.83 | BUY | 21 | 118.64 | BUY | |
| 34 | 118.66 | BUY | 34 | 119.08 | BUY | |
| 55 | 119.43 | BUY | 55 | 120.20 | BUY | |
| 90 | 123.24 | SELL | 90 | 122.19 | SELL | |
| 200 | 128.51 | SELL | 200 | 127.89 | SELL |
American Water Works Co Inc
IPO: 2008-04-23
Ticker: AWKIndices: S&P 500,
Exchange: New York Stock Exchange, Inc. (US - USD)
Website: https://www.amwater.com/
Phone:
Common Stock
Energy & Transportation (
Water Supply
 Click to Enlarge