| Date | Price $ | Result % | Candle Name | Side |
|---|---|---|---|---|
| 001 22 Mar 2024 | Sell Price: 225.96 | Profit: Open Day1 ($ 225.34) | Abandoned Baby | Sell |
| 002 06 Mar 2024 | Buy Price: 218.45 | Profit: Open Day1 ($ 221.01) | Abandoned Baby | Buy |
| 003 02 Jan 2024 | Buy Price: 188.31 | Loss: Close Day2 ($ 187.11) | Engulfing | Buy |
| 004 09 Nov 2023 | Sell Price: 152.37 | Loss: Close Day2 ($ 154.34) | Engulfing | Sell |
| 005 12 Oct 2023 | Sell Price: 151.28 | Profit: Close Day1 ($ 151.10) | Engulfing | Sell |
| 006 18 Sep 2023 | Sell Price: 159.63 | Profit: Open Day1 ($ 159.05) | Engulfing | Sell |
| 007 08 Aug 2023 | Sell Price: 165.87 | Profit: Close Day1 ($ 163.82) | Abandoned Baby | Sell |
| 008 26 Jul 2023 | Buy Price: 167.75 | Profit: Open Day1 ($ 168.53) | Engulfing | Buy |
| 009 10 Jul 2023 | Buy Price: 171.71 | Profit: Open Day1 ($ 172.50) | Abandoned Baby | Buy |
| 010 14 Jun 2023 | Sell Price: 174.27 | Profit: Open Day1 ($ 171.41) | Engulfing | Sell |
| 011 14 Jun 2023 | Sell Price: 174.47 | Profit: Open Day1 ($ 171.41) | Dark Cloud Cover | Sell |
| 012 25 May 2023 | Buy Price: 151.08 | Profit: Open Day1 ($ 152.81) | Piercing Line | Buy |
| 013 19 May 2023 | Sell Price: 152.95 | Profit: Close Day2 ($ 152.53) | Dark Cloud Cover | Sell |
| 014 05 May 2023 | Buy Price: 152.65 | Profit: Open Day1 ($ 153.41) | Abandoned Baby | Buy |
| 015One Year Average | Both Sides Result for 14 Signals |
Profit: $ 13.22 ($ 0.94 / Signal) |
All of Them | Buy + Sell |
| Simple Moving Averages (SMA) Period | Value $ | Signal | Exponential Moving Averages (EMA) Period | Value $ | Signal | |
|---|---|---|---|---|---|---|
| 2 | 224.27 | BUY | 2 | 226.59 | BUY | |
| 3 | 222.07 | BUY | 3 | 224.42 | BUY | |
| 5 | 220.59 | BUY | 5 | 222.43 | BUY | |
| 8 | 219.63 | BUY | 8 | 221.55 | BUY | |
| 13 | 220.74 | BUY | 13 | 221.46 | BUY | |
| 21 | 223.04 | BUY | 21 | 221.38 | BUY | |
| 34 | 222.36 | BUY | 34 | 219.82 | BUY | |
| 55 | 218.48 | BUY | 55 | 215.05 | BUY | |
| 90 | 205.69 | BUY | 90 | 206.39 | BUY | |
| 200 | 180.33 | BUY | 200 | 189.29 | BUY |
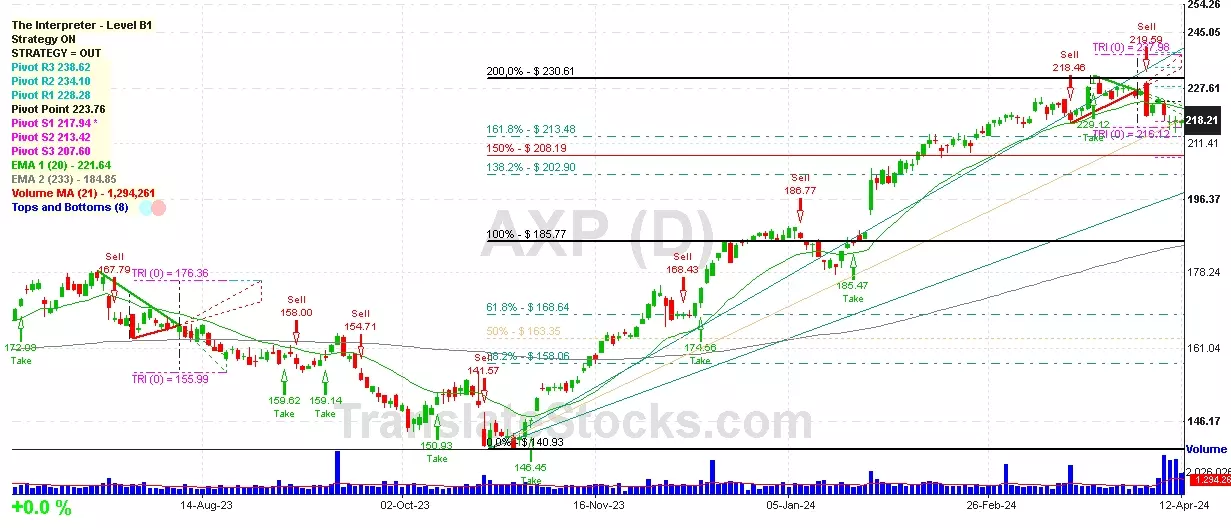
American Express Co
IPO: 1977-05-18
Website: https://www.americanexpress.com
Phone:
Common Stock
Finance (
Finance Services

 Click to Enlarge