| Date | Price $ | Result % | Candle Name | Side |
|---|---|---|---|---|
| 001 22 Mar 2024 | Sell Price: 41.94 | Profit: Close Day1 ($ 41.79) | Engulfing | Sell |
| 002 23 Feb 2024 | Buy Price: 42.55 | Loss: Close Day2 ($ 41.85) | Engulfing | Buy |
| 003 01 Feb 2024 | Buy Price: 39.19 | Loss: Close Day2 ($ 38.52) | Engulfing | Buy |
| 004 18 Jan 2024 | Buy Price: 38.84 | Profit: Open Day1 ($ 38.88) | Engulfing | Buy |
| 005 30 Nov 2023 | Sell Price: 36.08 | Loss: Close Day2 ($ 36.89) | Abandoned Baby | Sell |
| 006 27 Oct 2023 | Sell Price: 32.16 | Profit: Close Day1 ($ 32.04) | Dark Cloud Cover | Sell |
| 007 26 Oct 2023 | Buy Price: 32.45 | Profit: Open Day1 ($ 32.68) | Engulfing | Buy |
| 008 19 Sep 2023 | Buy Price: 38.96 | Profit: Open Day1 ($ 39.24) | Piercing Line | Buy |
| 009 13 Sep 2023 | Buy Price: 39.11 | Profit: Open Day1 ($ 39.30) | Engulfing | Buy |
| 010 20 Jun 2023 | Sell Price: 44.94 | Profit: Open Day1 ($ 44.82) | Abandoned Baby | Sell |
| 011 18 May 2023 | Buy Price: 43.03 | Profit: Open Day1 ($ 43.25) | Engulfing | Buy |
| 012 18 May 2023 | Buy Price: 43.01 | Profit: Open Day1 ($ 43.25) | Piercing Line | Buy |
| 013One Year Average | Both Sides Result for 12 Signals |
Loss: $ -0.59 ($ -0.05 / Signal) |
All of Them | Buy + Sell |
| Simple Moving Averages (SMA) Period | Value $ | Signal | Exponential Moving Averages (EMA) Period | Value $ | Signal | |
|---|---|---|---|---|---|---|
| 2 | 40.71 | BUY | 2 | 40.71 | BUY | |
| 3 | 40.29 | BUY | 3 | 40.51 | BUY | |
| 5 | 40.01 | BUY | 5 | 40.36 | BUY | |
| 8 | 40.00 | BUY | 8 | 40.46 | BUY | |
| 13 | 40.91 | BUY | 13 | 40.77 | BUY | |
| 21 | 41.57 | SELL | 21 | 41.12 | SELL | |
| 34 | 41.92 | SELL | 34 | 41.28 | SELL | |
| 55 | 41.55 | SELL | 55 | 41.06 | SELL | |
| 90 | 40.53 | BUY | 90 | 40.55 | BUY | |
| 200 | 39.58 | BUY | 200 | 40.94 | BUY |
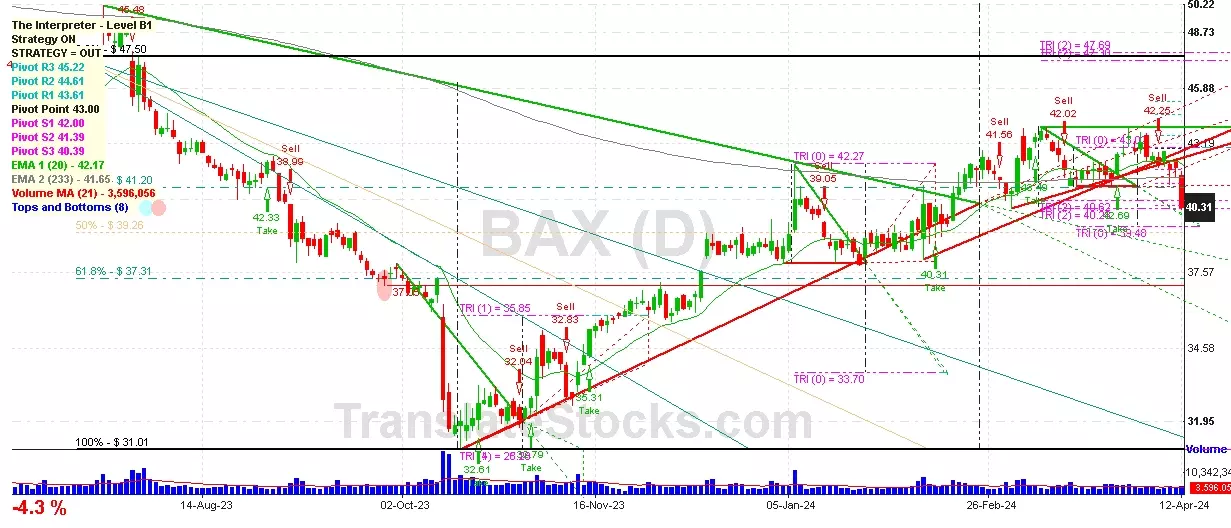
Baxter International Inc
IPO: 1961-05-15
Ticker: BAXIndices: S&P 500,
Exchange: New York Stock Exchange, Inc. (US - USD)
Website: https://www.baxter.com/
Phone:
Common Stock
Life Sciences (
Surgical & Medical Instruments & Apparatus

 Click to Enlarge