
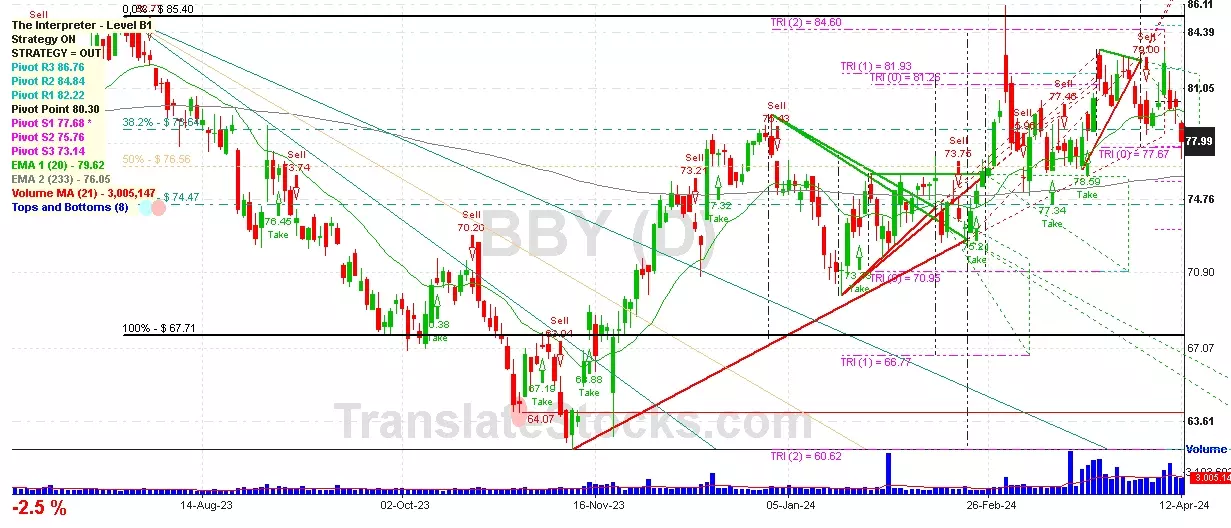
Hey Friend, I'm analysing BEST BUY CO INC (BBY), and it is between the Support of $ 77.68 (PivotS1) and the Resistance of $ 78.64 (38.2% of Fibonacci). The stock is also approaching the line of PivotS1 at $ 77.68, and if it goes below this line it could reach the next Support of Triangle projection at $77.67.

| Date | Price $ | Result % | Candle Name | Side |
|---|---|---|---|---|
| 001 19 Mar 2024 | Buy Price: 78.23 | Profit: Open Day1 ($ 79.51) | Engulfing | Buy |
| 002 15 Mar 2024 | Buy Price: 78.02 | Profit: Close Day2 ($ 78.20) | Engulfing | Buy |
| 003 06 Mar 2024 | Buy Price: 78.21 | Profit: Open Day1 ($ 78.40) | Engulfing | Buy |
| 004 11 Jan 2024 | Sell Price: 74.65 | Profit: Close Day1 ($ 73.86) | Engulfing | Sell |
| 005 18 Oct 2023 | Sell Price: 70.20 | Profit: Close Day1 ($ 69.50) | Abandoned Baby | Sell |
| 006 20 Sep 2023 | Sell Price: 70.75 | Profit: Open Day1 ($ 70.00) | Dark Cloud Cover | Sell |
| 007 18 Aug 2023 | Buy Price: 78.63 | Profit: Close Day1 ($ 78.88) | Engulfing | Buy |
| 008 18 Aug 2023 | Buy Price: 78.59 | Profit: Open Day1 ($ 78.62) | Piercing Line | Buy |
| 009 10 Aug 2023 | Buy Price: 80.41 | Loss: Close Day2 ($ 79.19) | Abandoned Baby | Buy |
| 010 26 Jul 2023 | Sell Price: 84.22 | Profit: Close Day1 ($ 83.54) | Engulfing | Sell |
| 011 23 Jun 2023 | Buy Price: 79.25 | Profit: Close Day1 ($ 81.40) | Engulfing | Buy |
| 012 23 Jun 2023 | Buy Price: 79.13 | Profit: Close Day1 ($ 81.40) | Piercing Line | Buy |
| 013 06 Jun 2023 | Buy Price: 74.35 | Profit: Open Day1 ($ 74.63) | Engulfing | Buy |
| 014One Year Average | Both Sides Result for 13 Signals |
Profit: $ 8.33 ($ 0.64 / Signal) |
All of Them | Buy + Sell |
| Simple Moving Averages (SMA) Period | Value $ | Signal | Exponential Moving Averages (EMA) Period | Value $ | Signal | |
|---|---|---|---|---|---|---|
| 2 | 76.07 | BUY | 2 | 76.10 | BUY | |
| 3 | 76.12 | BUY | 3 | 76.16 | SELL | |
| 5 | 75.97 | BUY | 5 | 76.49 | SELL | |
| 8 | 77.22 | SELL | 8 | 77.08 | SELL | |
| 13 | 78.33 | SELL | 13 | 77.77 | SELL | |
| 21 | 79.38 | SELL | 21 | 78.21 | SELL | |
| 34 | 78.75 | SELL | 34 | 78.15 | SELL | |
| 55 | 77.61 | SELL | 55 | 77.54 | SELL | |
| 90 | 76.57 | SELL | 90 | 76.58 | SELL | |
| 200 | 74.82 | BUY | 200 | 75.79 | BUY |
Best Buy Co Inc
IPO: 1987-07-20
Ticker: BBYIndices: S&P 500,
Exchange: New York Stock Exchange, Inc. (US - USD)
Website: https://www.bestbuy.com/
Phone:
Common Stock
Trade & Services (
Retail-radio, Tv & Consumer Electronics Stores
 Click to Enlarge