| Date | Price $ | Result % | Candle Name | Side |
|---|---|---|---|---|
| 001 15 Mar 2024 | Sell Price: 333.68 | Profit: Close Day1 ($ 333.43) | Abandoned Baby | Sell |
| 002 15 Mar 2024 | Buy Price: 333.51 | Profit: Open Day1 ($ 333.87) | Piercing Line | Buy |
| 003 12 Mar 2024 | Sell Price: 337.22 | Profit: Close Day1 ($ 336.43) | Engulfing | Sell |
| 004 01 Mar 2024 | Buy Price: 332.30 | Profit: Open Day1 ($ 332.87) | Engulfing | Buy |
| 005 31 Jan 2024 | Sell Price: 320.89 | Profit: Open Day1 ($ 320.36) | Engulfing | Sell |
| 006 25 Jan 2024 | Sell Price: 316.30 | Loss: Close Day2 ($ 330.04) | Engulfing | Sell |
| 007 12 Jan 2024 | Sell Price: 318.56 | Profit: Open Day1 ($ 316.08) | Engulfing | Sell |
| 008 08 Jan 2024 | Buy Price: 321.98 | Loss: Close Day2 ($ 320.12) | Abandoned Baby | Buy |
| 009 13 Dec 2023 | Buy Price: 314.26 | Profit: Open Day1 ($ 316.35) | Engulfing | Buy |
| 010 15 Nov 2023 | Sell Price: 306.89 | Profit: Close Day1 ($ 304.50) | Abandoned Baby | Sell |
| 011 11 Oct 2023 | Sell Price: 357.00 | Profit: Open Day1 ($ 356.27) | Engulfing | Sell |
| 012 05 Jul 2023 | Buy Price: 378.35 | Profit: Close Day2 ($ 386.13) | Engulfing | Buy |
| 013 05 Jul 2023 | Buy Price: 377.77 | Profit: Close Day2 ($ 386.13) | Piercing Line | Buy |
| 014 23 Jun 2023 | Buy Price: 365.80 | Profit: Open Day2 ($ 365.93) | Piercing Line | Buy |
| 015 15 Jun 2023 | Buy Price: 379.06 | Profit: Open Day1 ($ 386.92) | Engulfing | Buy |
| 016 31 May 2023 | Sell Price: 373.35 | Profit: Close Day1 ($ 371.36) | Abandoned Baby | Sell |
| 017 17 May 2023 | Sell Price: 380.43 | Profit: Close Day1 ($ 380.30) | Engulfing | Sell |
| 018 17 May 2023 | Sell Price: 381.53 | Profit: Open Day1 ($ 380.74) | Dark Cloud Cover | Sell |
| 019One Year Average | Both Sides Result for 18 Signals |
Profit: $ 21.63 ($ 1.20 / Signal) |
All of Them | Buy + Sell |
| Simple Moving Averages (SMA) Period | Value $ | Signal | Exponential Moving Averages (EMA) Period | Value $ | Signal | |
|---|---|---|---|---|---|---|
| 2 | 282.65 | BUY | 2 | 283.62 | BUY | |
| 3 | 281.68 | BUY | 3 | 283.58 | BUY | |
| 5 | 283.38 | BUY | 5 | 285.85 | SELL | |
| 8 | 288.82 | SELL | 8 | 291.13 | SELL | |
| 13 | 303.37 | SELL | 13 | 299.40 | SELL | |
| 21 | 316.17 | SELL | 21 | 308.43 | SELL | |
| 34 | 324.96 | SELL | 34 | 315.89 | SELL | |
| 55 | 327.08 | SELL | 55 | 320.38 | SELL | |
| 90 | 323.51 | SELL | 90 | 324.13 | SELL | |
| 200 | 339.28 | SELL | 200 | 343.47 | SELL |
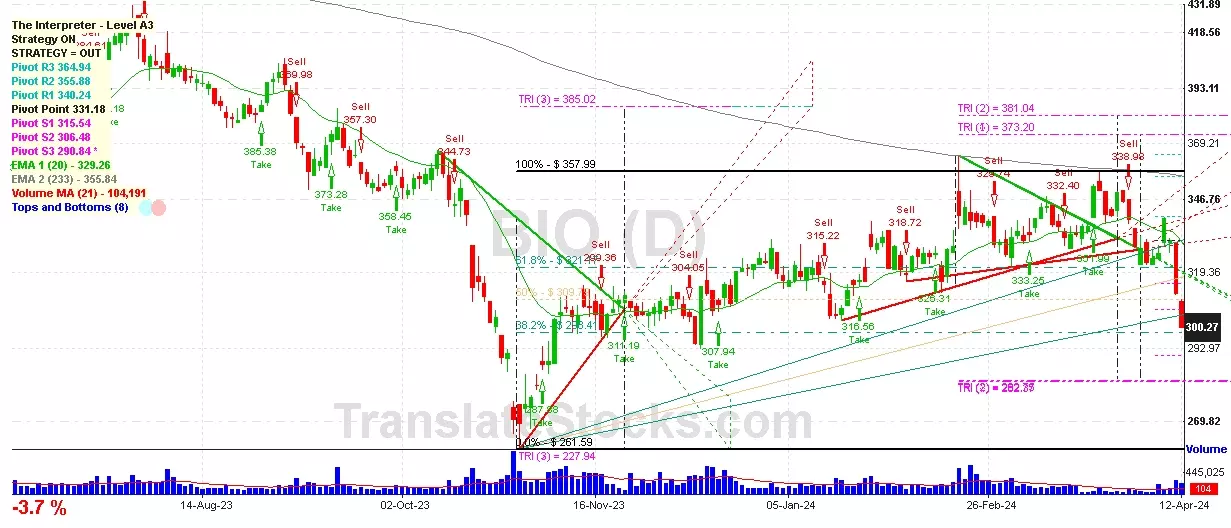
Bio-rad Laboratories-a
IPO: 1981-05-22
Ticker: BIOIndices: S&P 500,
Exchange: New York Stock Exchange, Inc. (US - USD)
Website: http://www.bio-rad.com/
Phone:
Common Stock
Life Sciences (
Laboratory Analytical Instruments

 Click to Enlarge