| Date | Price $ | Result % | Candle Name | Side |
|---|---|---|---|---|
| 001 27 Mar 2024 | Buy Price: 33.09 | Profit: Open Day1 ($ 33.44) | Piercing Line | Buy |
| 002 22 Mar 2024 | Sell Price: 33.44 | Profit: Close Day1 ($ 33.29) | Engulfing | Sell |
| 003 04 Mar 2024 | Sell Price: 29.43 | Loss: Close Day2 ($ 30.56) | Engulfing | Sell |
| 004 12 Feb 2024 | Buy Price: 29.50 | Loss: Close Day2 ($ 28.85) | Engulfing | Buy |
| 005 19 Jan 2024 | Sell Price: 30.70 | Profit: Open Day1 ($ 30.60) | Engulfing | Sell |
| 006 24 Nov 2023 | Buy Price: 33.89 | Profit: Close Day1 ($ 33.97) | Abandoned Baby | Buy |
| 007 15 Nov 2023 | Sell Price: 34.66 | Profit: Open Day1 ($ 34.37) | Abandoned Baby | Sell |
| 008 08 May 2023 | Sell Price: 28.10 | Profit: Open Day1 ($ 27.85) | Engulfing | Sell |
| 009 08 May 2023 | Sell Price: 28.11 | Profit: Open Day1 ($ 27.85) | Dark Cloud Cover | Sell |
| 010One Year Average | Both Sides Result for 9 Signals |
Loss: $ -0.31 ($ -0.03 / Signal) |
All of Them | Buy + Sell |
| Simple Moving Averages (SMA) Period | Value $ | Signal | Exponential Moving Averages (EMA) Period | Value $ | Signal | |
|---|---|---|---|---|---|---|
| 2 | 32.40 | BUY | 2 | 32.46 | BUY | |
| 3 | 32.27 | BUY | 3 | 32.42 | BUY | |
| 5 | 32.27 | BUY | 5 | 32.51 | BUY | |
| 8 | 32.82 | SELL | 8 | 32.72 | SELL | |
| 13 | 33.32 | SELL | 13 | 32.90 | SELL | |
| 21 | 33.34 | SELL | 21 | 32.85 | SELL | |
| 34 | 32.63 | SELL | 34 | 32.55 | BUY | |
| 55 | 31.36 | BUY | 55 | 32.25 | BUY | |
| 90 | 31.71 | BUY | 90 | 32.22 | BUY | |
| 200 | 33.49 | SELL | 200 | 32.21 | BUY |
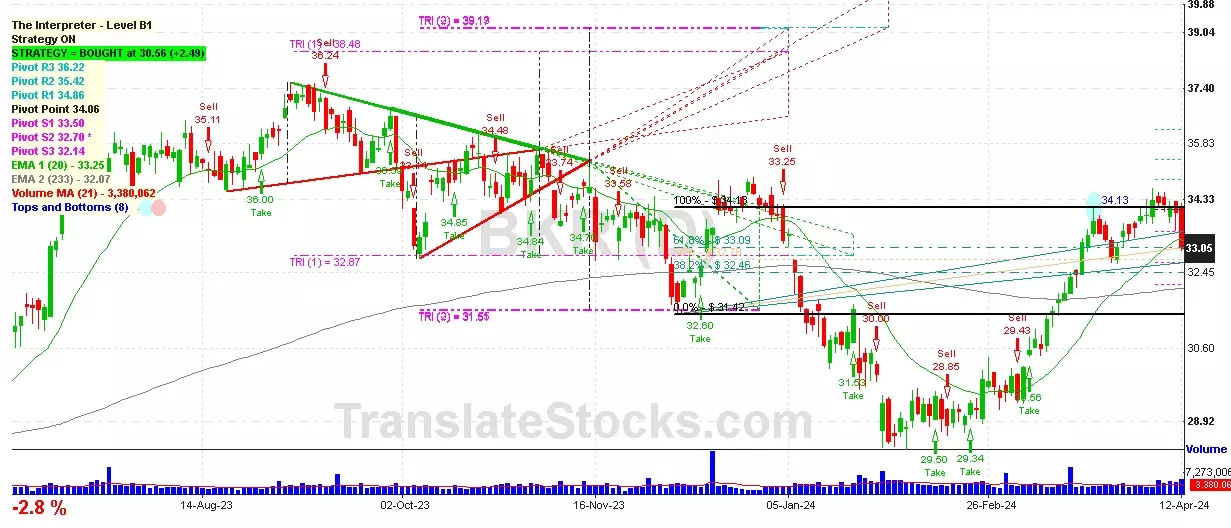
Baker Hughes Co
IPO: 1987-04-06
Ticker: BKRIndices: S&P 500,
Exchange: New York Stock Exchange, Inc. (US - USD)
Website: https://www.bakerhughes.com/
Phone:
Common Stock
Technology (
Oil & Gas Field Machinery & Equipment

 Click to Enlarge