
| Date | Price $ | Result % | Candle Name | Side |
|---|---|---|---|---|
| 001 02 Apr 2024 | Sell Price: 34.74 | Profit: Open Day1 ($ 34.48) | Abandoned Baby | Sell |
| 002 08 Mar 2024 | Sell Price: 32.04 | Profit: Open Day1 ($ 31.89) | Dark Cloud Cover | Sell |
| 003 27 Feb 2024 | Buy Price: 30.68 | Profit: Close Day1 ($ 30.78) | Abandoned Baby | Buy |
| 004 19 Jan 2024 | Buy Price: 32.87 | Profit: Open Day1 ($ 33.08) | Piercing Line | Buy |
| 005 26 Oct 2023 | Buy Price: 38.26 | Loss: Close Day2 ($ 36.71) | Abandoned Baby | Buy |
| 006 12 Oct 2023 | Sell Price: 39.25 | Profit: Close Day1 ($ 38.70) | Abandoned Baby | Sell |
| 007 23 Aug 2023 | Buy Price: 39.84 | Profit: Open Day2 ($ 39.89) | Piercing Line | Buy |
| 008 27 Jul 2023 | Sell Price: 45.80 | Loss: Close Day2 ($ 46.50) | Dark Cloud Cover | Sell |
| 009 18 Jul 2023 | Buy Price: 45.65 | Profit: Open Day1 ($ 45.90) | Abandoned Baby | Buy |
| 010 11 Jul 2023 | Buy Price: 45.57 | Profit: Open Day1 ($ 46.26) | Engulfing | Buy |
| 011 20 Jun 2023 | Sell Price: 46.39 | Profit: Open Day1 ($ 46.35) | Abandoned Baby | Sell |
| 012 25 May 2023 | Buy Price: 46.86 | Profit: Open Day1 ($ 47.11) | Engulfing | Buy |
| 013 28 Apr 2023 | Buy Price: 48.13 | Profit: Open Day1 ($ 48.31) | Piercing Line | Buy |
| 014One Year Average | Both Sides Result for 13 Signals |
Profit: $ 0.48 ($ 0.04 / Signal) |
All of Them | Buy + Sell |
| Simple Moving Averages (SMA) Period | Value $ | Signal | Exponential Moving Averages (EMA) Period | Value $ | Signal | |
|---|---|---|---|---|---|---|
| 2 | 31.98 | BUY | 2 | 32.12 | SELL | |
| 3 | 32.13 | SELL | 3 | 32.27 | SELL | |
| 5 | 32.61 | SELL | 5 | 32.65 | SELL | |
| 8 | 33.50 | SELL | 8 | 33.07 | SELL | |
| 13 | 33.98 | SELL | 13 | 33.39 | SELL | |
| 21 | 33.92 | SELL | 21 | 33.43 | SELL | |
| 34 | 33.15 | SELL | 34 | 33.29 | SELL | |
| 55 | 32.63 | SELL | 55 | 33.27 | SELL | |
| 90 | 33.28 | SELL | 90 | 33.71 | SELL | |
| 200 | 36.73 | SELL | 200 | 35.41 | SELL |
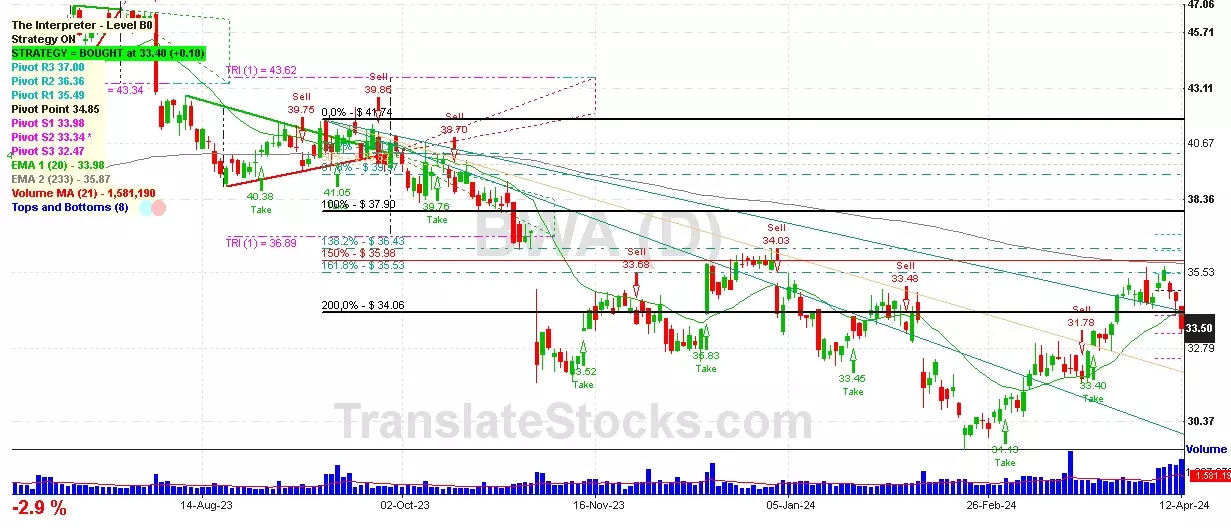
Borgwarner Inc
IPO: 1993-08-13
Ticker: BWAIndices: S&P 500,
Exchange: New York Stock Exchange, Inc. (US - USD)
Website: https://www.borgwarner.com/
Phone:
Common Stock
Manufacturing (
Motor Vehicle Parts & Accessories

 Click to Enlarge