| Date | Price $ | Result % | Candle Name | Side |
|---|---|---|---|---|
| 001 26 Mar 2024 | Sell Price: 28.91 | Loss: Close Day2 ($ 29.64) | Engulfing | Sell |
| 002 07 Mar 2024 | Sell Price: 27.80 | Loss: Close Day2 ($ 28.53) | Engulfing | Sell |
| 003 26 Jan 2024 | Sell Price: 29.62 | Profit: Open Day1 ($ 29.35) | Dark Cloud Cover | Sell |
| 004 08 Jan 2024 | Buy Price: 28.73 | Profit: Close Day1 ($ 29.32) | Engulfing | Buy |
| 005 21 Nov 2023 | Buy Price: 28.20 | Profit: Open Day1 ($ 28.36) | Abandoned Baby | Buy |
| 006 14 Nov 2023 | Buy Price: 28.02 | Profit: Close Day1 ($ 28.15) | Abandoned Baby | Buy |
| 007 10 Nov 2023 | Sell Price: 27.81 | Profit: Open Day1 ($ 27.72) | Engulfing | Sell |
| 008 06 Oct 2023 | Buy Price: 26.41 | Profit: Open Day1 ($ 26.42) | Abandoned Baby | Buy |
| 009 15 May 2023 | Sell Price: 36.52 | Profit: Open Day1 ($ 36.45) | Engulfing | Sell |
| 010 15 May 2023 | Sell Price: 36.54 | Profit: Open Day1 ($ 36.45) | Dark Cloud Cover | Sell |
| 011 27 Apr 2023 | Buy Price: 37.90 | Profit: Close Day1 ($ 37.96) | Engulfing | Buy |
| 012One Year Average | Both Sides Result for 11 Signals |
Profit: $ 0.02 ($ 0.00 / Signal) |
All of Them | Buy + Sell |
| Simple Moving Averages (SMA) Period | Value $ | Signal | Exponential Moving Averages (EMA) Period | Value $ | Signal | |
|---|---|---|---|---|---|---|
| 2 | 31.42 | SELL | 2 | 31.32 | SELL | |
| 3 | 31.37 | SELL | 3 | 31.28 | SELL | |
| 5 | 31.17 | BUY | 5 | 31.13 | BUY | |
| 8 | 30.81 | BUY | 8 | 30.93 | BUY | |
| 13 | 30.57 | BUY | 13 | 30.67 | BUY | |
| 21 | 30.37 | BUY | 21 | 30.33 | BUY | |
| 34 | 29.68 | BUY | 34 | 29.92 | BUY | |
| 55 | 28.98 | BUY | 55 | 29.53 | BUY | |
| 90 | 28.98 | BUY | 90 | 29.30 | BUY | |
| 200 | 29.14 | BUY | 200 | 29.95 | BUY |
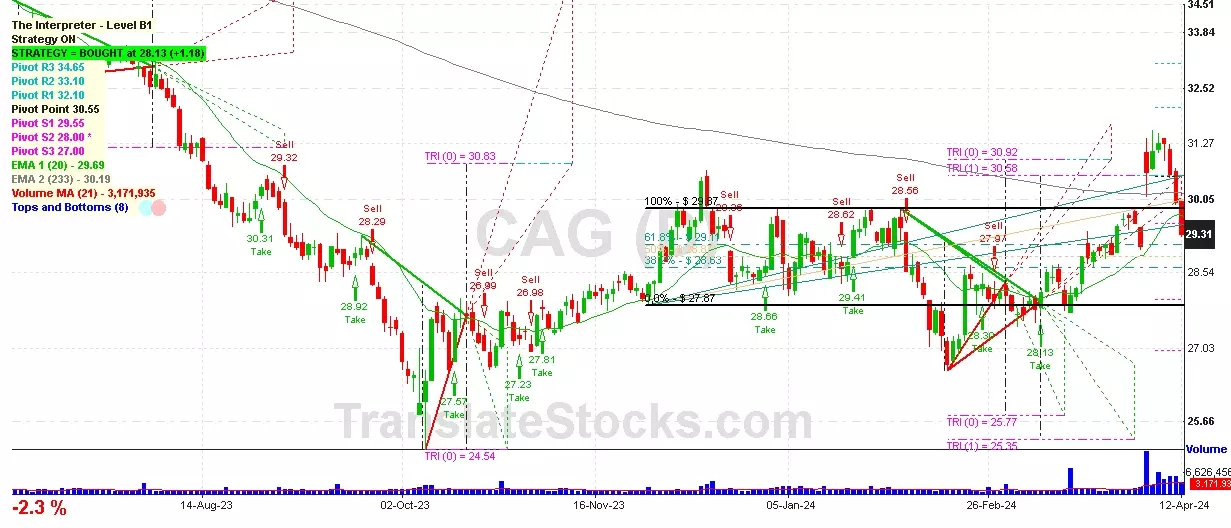
Conagra Brands Inc
IPO: 1973-01-09
Ticker: CAGIndices: S&P 500,
Exchange: New York Stock Exchange, Inc. (US - USD)
Website: https://www.conagrabrands.com/
Phone:
Common Stock
Manufacturing (
Food And Kindred Products

 Click to Enlarge