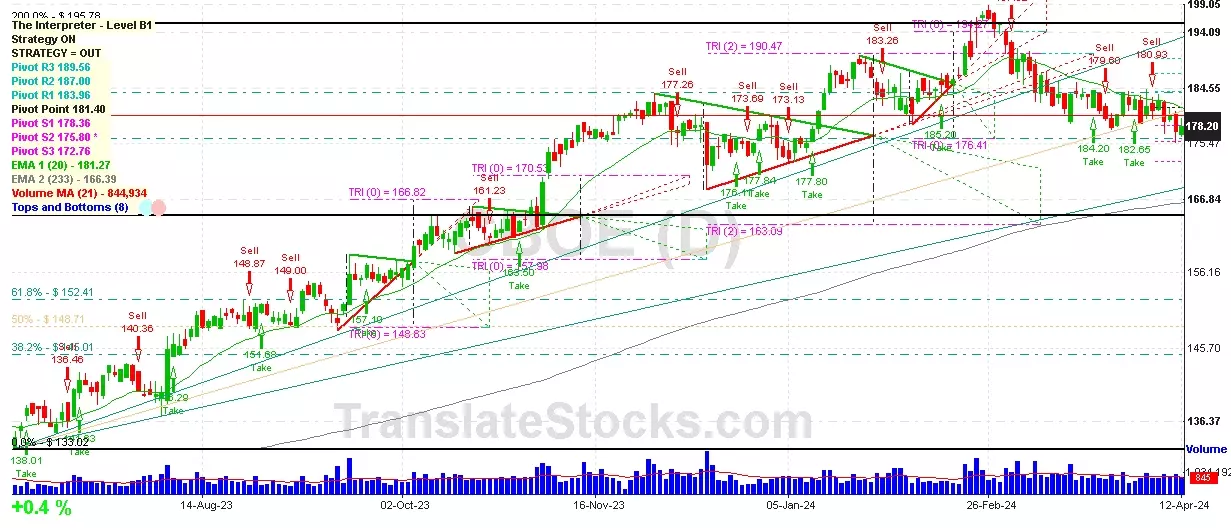
Hey Friend, I'm analysing CBOE GLOBAL MARKETS INC (CBOE), and it is between the Support of $ 176.41 (Triangle Projection Level 0) and the Resistance of $ 178.36 (PivotS1). The stock is also approaching the line of PivotS1 at $ 178.36, and if it goes above this line it could reach the next Resistance of 50% of Fibonacci at $ 178.37.

| Date | Price $ | Result % | Candle Name | Side |
|---|---|---|---|---|
| 001 05 Apr 2024 | Sell Price: 180.09 | Profit: Close Day2 ($ 179.09) | Engulfing | Sell |
| 002 05 Apr 2024 | Sell Price: 180.93 | Profit: Close Day2 ($ 179.09) | Dark Cloud Cover | Sell |
| 003 21 Mar 2024 | Buy Price: 184.20 | Loss: Close Day2 ($ 179.32) | Engulfing | Buy |
| 004 14 Mar 2024 | Sell Price: 181.13 | Profit: Open Day1 ($ 179.01) | Engulfing | Sell |
| 005 06 Dec 2023 | Sell Price: 177.76 | Profit: Open Day1 ($ 177.56) | Engulfing | Sell |
| 006 29 Nov 2023 | Sell Price: 179.50 | Loss: Close Day2 ($ 180.26) | Abandoned Baby | Sell |
| 007 06 Sep 2023 | Buy Price: 149.98 | Profit: Open Day1 ($ 150.90) | Engulfing | Buy |
| 008 24 Aug 2023 | Sell Price: 148.87 | Profit: Open Day1 ($ 148.43) | Engulfing | Sell |
| 009 23 Aug 2023 | Buy Price: 150.12 | Profit: Open Day1 ($ 150.57) | Piercing Line | Buy |
| 010 01 Aug 2023 | Buy Price: 139.95 | Loss: Close Day2 ($ 139.54) | Abandoned Baby | Buy |
| 011 24 Jul 2023 | Sell Price: 142.31 | Profit: Open Day1 ($ 141.47) | Abandoned Baby | Sell |
| 012 03 Jul 2023 | Sell Price: 137.40 | Profit: Close Day2 ($ 137.04) | Engulfing | Sell |
| 013 03 Jul 2023 | Sell Price: 137.40 | Profit: Close Day2 ($ 137.04) | Dark Cloud Cover | Sell |
| 014 27 Jun 2023 | Buy Price: 134.16 | Profit: Close Day1 ($ 134.52) | Piercing Line | Buy |
| 015 12 May 2023 | Sell Price: 138.38 | Profit: Close Day2 ($ 138.04) | Engulfing | Sell |
| 016 12 May 2023 | Sell Price: 138.78 | Profit: Close Day2 ($ 138.04) | Dark Cloud Cover | Sell |
| 017One Year Average | Both Sides Result for 16 Signals |
Profit: $ 3.92 ($ 0.24 / Signal) |
All of Them | Buy + Sell |
| Simple Moving Averages (SMA) Period | Value $ | Signal | Exponential Moving Averages (EMA) Period | Value $ | Signal | |
|---|---|---|---|---|---|---|
| 2 | 179.25 | BUY | 2 | 179.50 | BUY | |
| 3 | 179.50 | BUY | 3 | 179.43 | BUY | |
| 5 | 179.37 | BUY | 5 | 179.24 | BUY | |
| 8 | 178.49 | BUY | 8 | 179.11 | BUY | |
| 13 | 178.88 | BUY | 13 | 179.28 | BUY | |
| 21 | 179.68 | BUY | 21 | 179.94 | SELL | |
| 34 | 180.96 | SELL | 34 | 180.97 | SELL | |
| 55 | 184.00 | SELL | 55 | 181.47 | SELL | |
| 90 | 182.42 | SELL | 90 | 179.93 | SELL | |
| 200 | 169.34 | BUY | 200 | 169.98 | BUY |
Cboe Global Markets Inc
IPO: 2010-06-15
Ticker: CBOEIndices: S&P 500,
Exchange: Bats Exchange (US - USD)
Website: http://www.cboe.com/
Phone:
Common Stock
Finance (
Security & Commodity Brokers, Dealers, Exchanges & Services
 Click to Enlarge