
| Date | Price $ | Result % | Candle Name | Side |
|---|---|---|---|---|
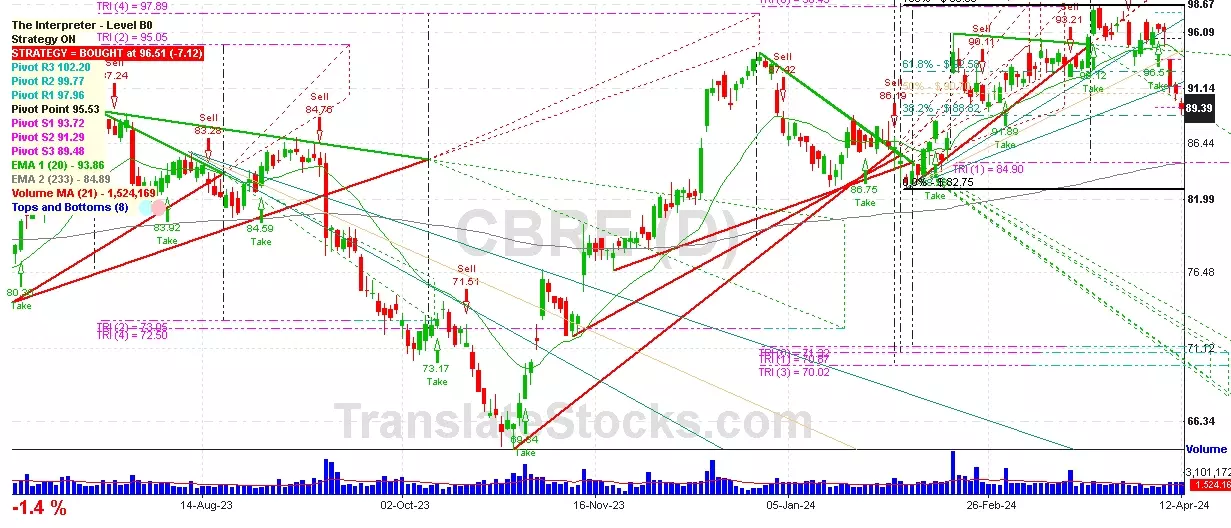
| 001 01 Apr 2024 | Sell Price: 94.98 | Profit: Open Day1 ($ 93.90) | Abandoned Baby | Sell |
| 002 22 Nov 2023 | Buy Price: 78.46 | Profit: Close Day1 ($ 79.01) | Abandoned Baby | Buy |
| 003 05 Oct 2023 | Buy Price: 72.24 | Profit: Close Day1 ($ 72.78) | Abandoned Baby | Buy |
| 004 05 Oct 2023 | Buy Price: 72.29 | Profit: Close Day1 ($ 72.78) | Engulfing | Buy |
| 005 12 Sep 2023 | Sell Price: 84.76 | Profit: Close Day1 ($ 79.07) | Abandoned Baby | Sell |
| 006 25 Aug 2023 | Sell Price: 82.58 | Loss: Close Day2 ($ 85.71) | Engulfing | Sell |
| 007 30 May 2023 | Sell Price: 75.05 | Profit: Open Day1 ($ 74.54) | Dark Cloud Cover | Sell |
| 008One Year Average | Both Sides Result for 7 Signals |
Profit: $ 5.73 ($ 0.82 / Signal) |
All of Them | Buy + Sell |
| Simple Moving Averages (SMA) Period | Value $ | Signal | Exponential Moving Averages (EMA) Period | Value $ | Signal | |
|---|---|---|---|---|---|---|
| 2 | 85.02 | SELL | 2 | 85.03 | SELL | |
| 3 | 85.06 | SELL | 3 | 85.29 | SELL | |
| 5 | 85.53 | SELL | 5 | 86.12 | SELL | |
| 8 | 87.38 | SELL | 8 | 87.51 | SELL | |
| 13 | 90.68 | SELL | 13 | 89.24 | SELL | |
| 21 | 92.79 | SELL | 21 | 90.67 | SELL | |
| 34 | 93.00 | SELL | 34 | 91.28 | SELL | |
| 55 | 91.36 | SELL | 55 | 90.77 | SELL | |
| 90 | 90.08 | SELL | 90 | 89.11 | SELL | |
| 200 | 84.02 | BUY | 200 | 85.41 | SELL |
Cbre Group Inc - A
IPO: 2004-06-10
Ticker: CBREIndices: S&P 500,
Exchange: New York Stock Exchange, Inc. (US - USD)
Website: https://www.cbre.us
Phone:
Common Stock
Real Estate & Construction (
Real Estate

 Click to Enlarge