| Date | Price $ | Result % | Candle Name | Side |
|---|---|---|---|---|
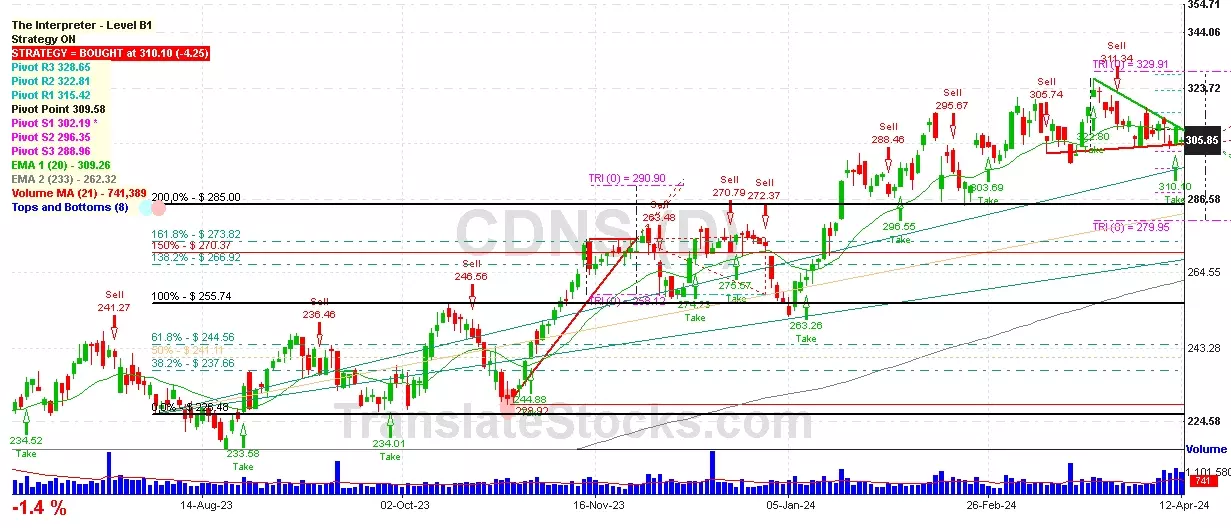
| 001 10 Apr 2024 | Sell Price: 304.59 | Loss: Close Day2 ($ 305.85) | Abandoned Baby | Sell |
| 002 03 Apr 2024 | Buy Price: 310.58 | Profit: Open Day1 ($ 314.90) | Engulfing | Buy |
| 003 13 Mar 2024 | Sell Price: 306.21 | Profit: Open Day2 ($ 304.25) | Engulfing | Sell |
| 004 15 Feb 2024 | Sell Price: 295.67 | Profit: Close Day1 ($ 290.30) | Engulfing | Sell |
| 005 30 Nov 2023 | Sell Price: 273.27 | Profit: Open Day1 ($ 272.85) | Engulfing | Sell |
| 006 30 Nov 2023 | Sell Price: 272.89 | Profit: Open Day1 ($ 272.85) | Dark Cloud Cover | Sell |
| 007 26 Sep 2023 | Sell Price: 229.26 | Loss: Close Day2 ($ 234.01) | Abandoned Baby | Sell |
| 008 08 Aug 2023 | Sell Price: 228.93 | Profit: Open Day1 ($ 228.17) | Abandoned Baby | Sell |
| 009 04 Aug 2023 | Buy Price: 229.00 | Profit: Open Day1 ($ 230.51) | Abandoned Baby | Buy |
| 010 08 Jun 2023 | Buy Price: 228.08 | Profit: Open Day1 ($ 229.59) | Engulfing | Buy |
| 011 31 May 2023 | Sell Price: 230.91 | Profit: Open Day1 ($ 228.57) | Abandoned Baby | Sell |
| 012One Year Average | Both Sides Result for 11 Signals |
Profit: $ 12.22 ($ 1.11 / Signal) |
All of Them | Buy + Sell |
| Simple Moving Averages (SMA) Period | Value $ | Signal | Exponential Moving Averages (EMA) Period | Value $ | Signal | |
|---|---|---|---|---|---|---|
| 2 | 279.71 | SELL | 2 | 279.33 | SELL | |
| 3 | 281.48 | SELL | 3 | 280.67 | SELL | |
| 5 | 282.12 | SELL | 5 | 283.49 | SELL | |
| 8 | 288.33 | SELL | 8 | 287.51 | SELL | |
| 13 | 296.13 | SELL | 13 | 292.53 | SELL | |
| 21 | 301.52 | SELL | 21 | 297.16 | SELL | |
| 34 | 305.23 | SELL | 34 | 299.78 | SELL | |
| 55 | 304.21 | SELL | 55 | 298.59 | SELL | |
| 90 | 293.81 | SELL | 90 | 292.19 | SELL | |
| 200 | 266.28 | BUY | 200 | 269.83 | BUY |
Cadence Design Sys Inc
IPO: 1988-06-01
Ticker: CDNSIndices: S&P 500,
Nasdaq 100,
Exchange: Nasdaq Nms - Global Market (US - USD)
Website: https://www.cadence.com/
Phone:
Common Stock
Technology (
Services-prepackaged Software

 Click to Enlarge