
| Date | Price $ | Result % | Candle Name | Side |
|---|---|---|---|---|
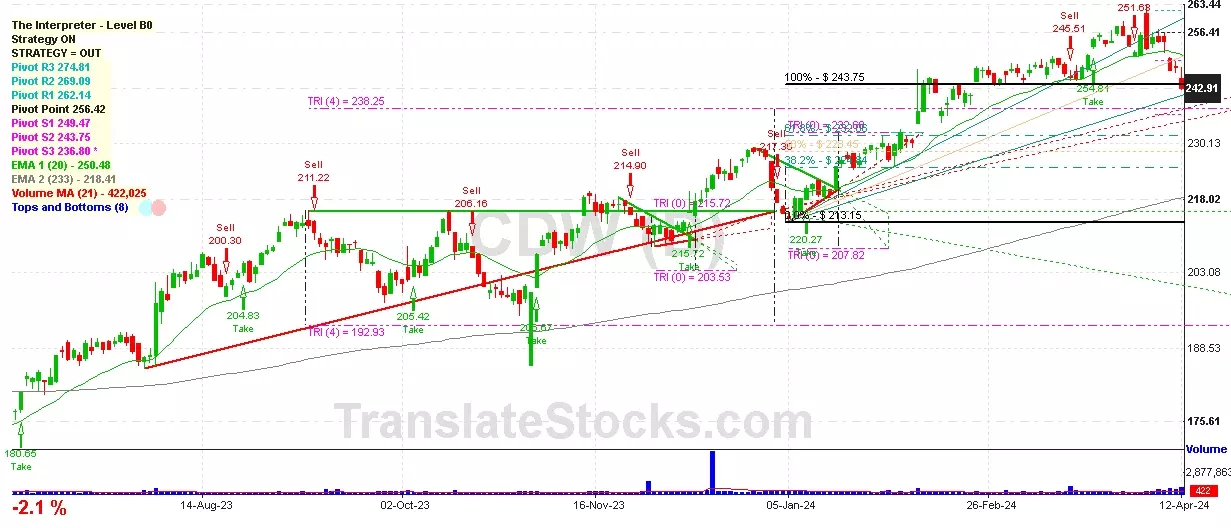
| 001 13 Mar 2024 | Sell Price: 248.63 | Profit: Close Day1 ($ 246.48) | Engulfing | Sell |
| 002 08 Mar 2024 | Sell Price: 247.95 | Profit: Open Day1 ($ 246.21) | Engulfing | Sell |
| 003 04 Mar 2024 | Sell Price: 246.67 | Profit: Open Day1 ($ 245.33) | Engulfing | Sell |
| 004 21 Dec 2023 | Buy Price: 225.10 | Profit: Open Day1 ($ 226.54) | Abandoned Baby | Buy |
| 005 24 Nov 2023 | Sell Price: 216.69 | Profit: Open Day1 ($ 216.26) | Engulfing | Sell |
| 006 24 Nov 2023 | Sell Price: 216.69 | Profit: Open Day1 ($ 216.26) | Dark Cloud Cover | Sell |
| 007 24 Oct 2023 | Buy Price: 199.89 | Loss: Close Day2 ($ 198.42) | Abandoned Baby | Buy |
| 008 12 Oct 2023 | Sell Price: 211.58 | Profit: Open Day1 ($ 211.23) | Dark Cloud Cover | Sell |
| 009 20 Sep 2023 | Buy Price: 209.00 | Loss: Close Day2 ($ 205.76) | Engulfing | Buy |
| 010 15 Sep 2023 | Sell Price: 207.00 | Profit: Open Day1 ($ 206.90) | Engulfing | Sell |
| 011 14 Sep 2023 | Buy Price: 209.79 | Profit: Open Day1 ($ 209.87) | Abandoned Baby | Buy |
| 012 08 Sep 2023 | Sell Price: 212.67 | Profit: Close Day1 ($ 211.22) | Dark Cloud Cover | Sell |
| 013 05 Sep 2023 | Sell Price: 212.64 | Profit: Open Day1 ($ 212.00) | Dark Cloud Cover | Sell |
| 014 27 Jun 2023 | Buy Price: 177.66 | Profit: Open Day2 ($ 177.69) | Engulfing | Buy |
| 015 31 May 2023 | Sell Price: 171.69 | Loss: Close Day2 ($ 174.22) | Abandoned Baby | Sell |
| 016 16 May 2023 | Sell Price: 170.03 | Loss: Close Day2 ($ 174.73) | Abandoned Baby | Sell |
| 017 02 May 2023 | Sell Price: 167.86 | Profit: Close Day1 ($ 164.97) | Abandoned Baby | Sell |
| 018One Year Average | Both Sides Result for 17 Signals |
Profit: $ 1.13 ($ 0.07 / Signal) |
All of Them | Buy + Sell |
| Simple Moving Averages (SMA) Period | Value $ | Signal | Exponential Moving Averages (EMA) Period | Value $ | Signal | |
|---|---|---|---|---|---|---|
| 2 | 240.58 | BUY | 2 | 240.24 | BUY | |
| 3 | 239.60 | BUY | 3 | 239.75 | BUY | |
| 5 | 238.06 | BUY | 5 | 239.49 | BUY | |
| 8 | 238.56 | BUY | 8 | 240.26 | BUY | |
| 13 | 242.70 | SELL | 13 | 242.14 | SELL | |
| 21 | 247.20 | SELL | 21 | 244.10 | SELL | |
| 34 | 248.06 | SELL | 34 | 244.73 | SELL | |
| 55 | 246.18 | SELL | 55 | 242.74 | SELL | |
| 90 | 237.67 | BUY | 90 | 237.45 | BUY | |
| 200 | 219.50 | BUY | 200 | 222.89 | BUY |
Cdw Corp/de
IPO: 2013-06-27
Ticker: CDWIndices: S&P 500,
Nasdaq 100,
Exchange: Nasdaq Nms - Global Market (US - USD)
Website: https://www.cdw.com/
Phone:
Common Stock
Trade & Services (
Retail-catalog & Mail-order Houses

 Click to Enlarge