| Date | Price $ | Result % | Candle Name | Side |
|---|---|---|---|---|
| 001 23 Apr 2024 | Sell Price: 120.83 | Profit: Open Day1 ($ 119.83) | Engulfing | Sell |
| 002 18 Apr 2024 | Buy Price: 117.52 | Profit: Open Day1 ($ 118.22) | Abandoned Baby | Buy |
| 003 20 Mar 2024 | Buy Price: 118.51 | Profit: Open Day1 ($ 118.60) | Engulfing | Buy |
| 004 20 Mar 2024 | Buy Price: 118.60 | Profit: Close Day1 ($ 118.84) | Piercing Line | Buy |
| 005 06 Mar 2024 | Buy Price: 117.79 | Profit: Open Day1 ($ 118.00) | Abandoned Baby | Buy |
| 006 26 Feb 2024 | Sell Price: 112.24 | Profit: Open Day1 ($ 112.22) | Abandoned Baby | Sell |
| 007 31 Jan 2024 | Sell Price: 110.80 | Profit: Open Day1 ($ 110.09) | Engulfing | Sell |
| 008 10 Jan 2024 | Buy Price: 107.42 | Profit: Open Day1 ($ 107.51) | Engulfing | Buy |
| 009 09 Jan 2024 | Sell Price: 106.51 | Profit: Open Day1 ($ 106.40) | Abandoned Baby | Sell |
| 010 30 Oct 2023 | Buy Price: 100.30 | Profit: Open Day1 ($ 100.39) | Abandoned Baby | Buy |
| 011 05 Sep 2023 | Sell Price: 105.06 | Profit: Close Day1 ($ 104.52) | Abandoned Baby | Sell |
| 012 08 Aug 2023 | Sell Price: 108.48 | Profit: Close Day2 ($ 107.54) | Abandoned Baby | Sell |
| 013 31 Jul 2023 | Sell Price: 107.58 | Profit: Open Day1 ($ 107.57) | Engulfing | Sell |
| 014One Year Average | Both Sides Result for 13 Signals |
Profit: $ 4.75 ($ 0.37 / Signal) |
All of Them | Buy + Sell |
| Simple Moving Averages (SMA) Period | Value $ | Signal | Exponential Moving Averages (EMA) Period | Value $ | Signal | |
|---|---|---|---|---|---|---|
| 2 | 119.18 | SELL | 2 | 119.01 | SELL | |
| 3 | 119.73 | SELL | 3 | 119.26 | SELL | |
| 5 | 120.02 | SELL | 5 | 119.32 | SELL | |
| 8 | 118.75 | SELL | 8 | 119.26 | SELL | |
| 13 | 118.87 | SELL | 13 | 119.27 | SELL | |
| 21 | 120.07 | SELL | 21 | 119.16 | SELL | |
| 34 | 119.56 | SELL | 34 | 118.44 | BUY | |
| 55 | 116.68 | BUY | 55 | 116.76 | BUY | |
| 90 | 113.11 | BUY | 90 | 114.22 | BUY | |
| 200 | 107.75 | BUY | 200 | 110.31 | BUY |
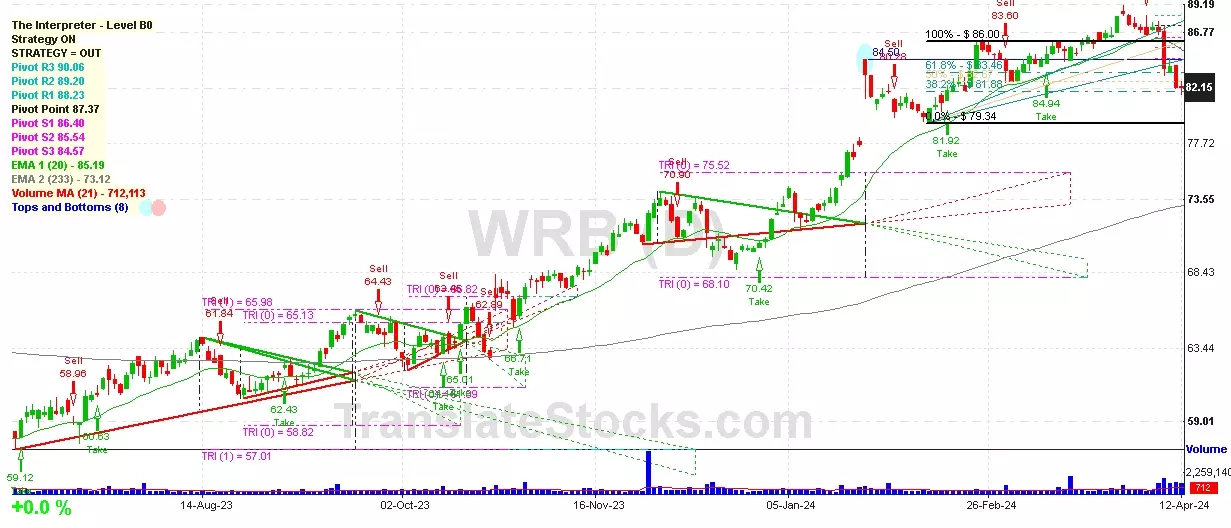
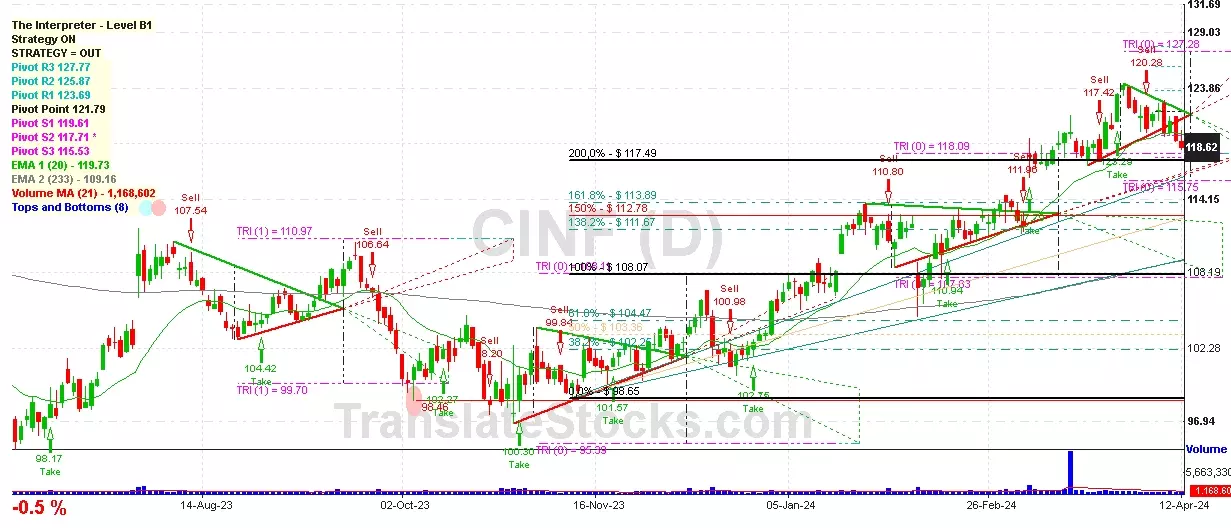
Cincinnati Financial Corp
IPO: 1980-03-17
Ticker: CINFIndices: S&P 500,
Exchange: Nasdaq Nms - Global Market (US - USD)
Website: https://www.cinfin.com/
Phone:
Common Stock
Finance (
Fire, Marine & Casualty Insurance

 Click to Enlarge