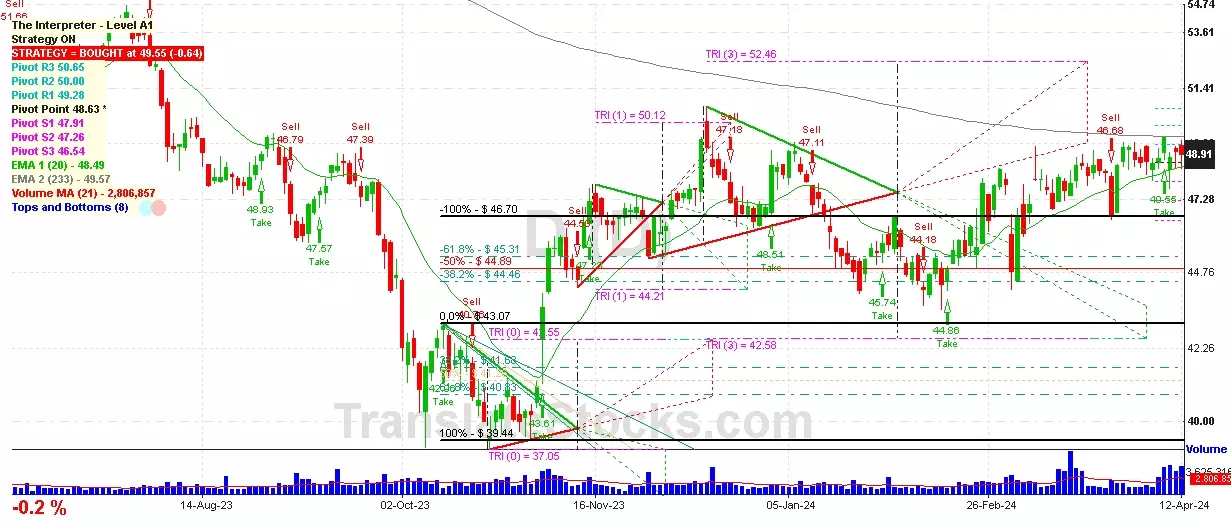
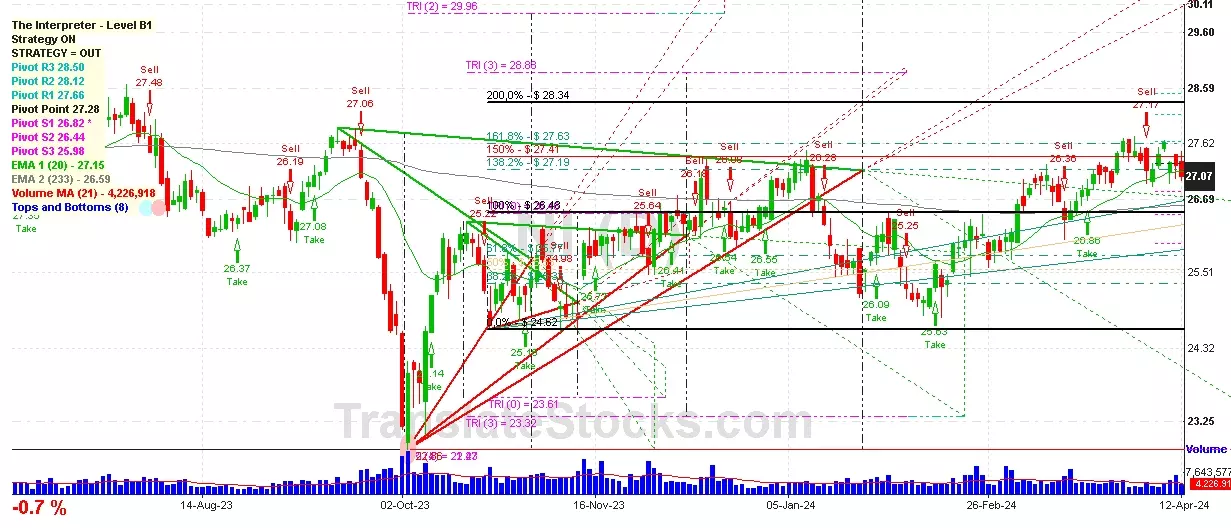
| Date | Price $ | Result % | Candle Name | Side |
|---|---|---|---|---|
| 001 08 Apr 2024 | Buy Price: 28.22 | Profit: Open Day1 ($ 28.31) | Abandoned Baby | Buy |
| 002 04 Mar 2024 | Buy Price: 27.94 | Profit: Open Day1 ($ 28.04) | Engulfing | Buy |
| 003 06 Feb 2024 | Buy Price: 27.61 | Profit: Open Day1 ($ 27.77) | Piercing Line | Buy |
| 004 10 Jan 2024 | Buy Price: 29.25 | Loss: Close Day2 ($ 28.57) | Engulfing | Buy |
| 005 04 Jan 2024 | Sell Price: 29.08 | Profit: Open Day1 ($ 29.03) | Dark Cloud Cover | Sell |
| 006 29 Nov 2023 | Sell Price: 27.89 | Loss: Close Day2 ($ 28.79) | Engulfing | Sell |
| 007 18 Aug 2023 | Buy Price: 28.19 | Profit: Close Day1 ($ 28.28) | Engulfing | Buy |
| 008 09 Aug 2023 | Buy Price: 28.99 | Profit: Open Day1 ($ 29.07) | Piercing Line | Buy |
| 009 02 Aug 2023 | Buy Price: 29.74 | Loss: Close Day2 ($ 29.03) | Engulfing | Buy |
| 010 02 Aug 2023 | Buy Price: 29.80 | Loss: Close Day2 ($ 29.03) | Piercing Line | Buy |
| 011 30 Jun 2023 | Buy Price: 29.15 | Profit: Close Day1 ($ 29.45) | Abandoned Baby | Buy |
| 012 21 Jun 2023 | Buy Price: 29.43 | Profit: Open Day1 ($ 29.52) | Engulfing | Buy |
| 013One Year Average | Both Sides Result for 12 Signals |
Loss: $ -2.10 ($ -0.18 / Signal) |
All of Them | Buy + Sell |
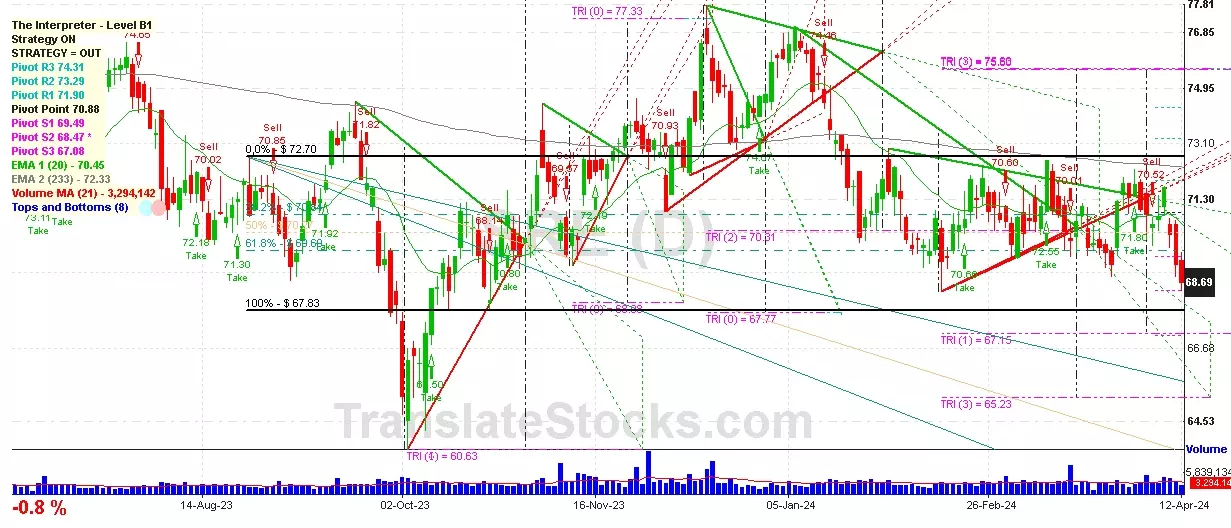
| Simple Moving Averages (SMA) Period | Value $ | Signal | Exponential Moving Averages (EMA) Period | Value $ | Signal | |
|---|---|---|---|---|---|---|
| 2 | 27.46 | BUY | 2 | 27.56 | BUY | |
| 3 | 27.44 | BUY | 3 | 27.52 | BUY | |
| 5 | 27.47 | BUY | 5 | 27.54 | BUY | |
| 8 | 27.65 | BUY | 8 | 27.62 | BUY | |
| 13 | 27.88 | SELL | 13 | 27.73 | SELL | |
| 21 | 27.91 | SELL | 21 | 27.81 | SELL | |
| 34 | 27.95 | SELL | 34 | 27.87 | SELL | |
| 55 | 27.87 | SELL | 55 | 27.92 | SELL | |
| 90 | 28.14 | SELL | 90 | 27.98 | SELL | |
| 200 | 28.21 | SELL | 200 | 28.24 | SELL |
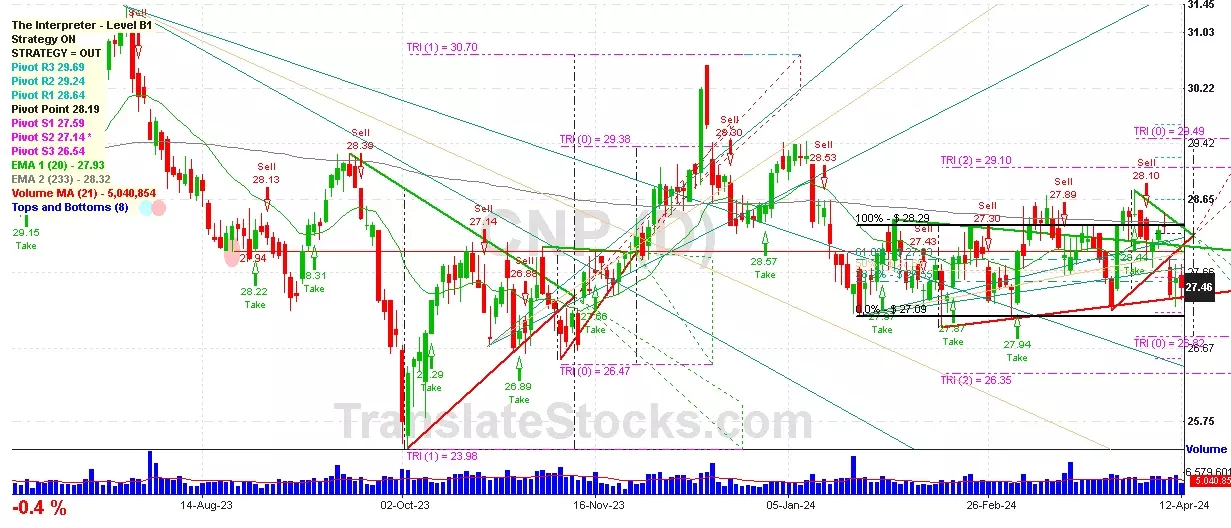
Centerpoint Energy Inc
IPO: 1943-08-16
Ticker: CNPIndices: S&P 500,
Exchange: New York Stock Exchange, Inc. (US - USD)
Website: https://www.centerpointenergy.com/
Phone:
Common Stock
Energy & Transportation (
Electric Services
Year | 2020 | 2019 | 2018 | 2017 | 2016 | 2015 | 2014 | 2013 | 2012 | 2011 | 2010 | 2009 | 2008 | 2007 | 2006 | |
|---|---|---|---|---|---|---|---|---|---|---|---|---|---|---|---|---|
| 1 | Assets + | 33,471 | 35,439 | 27,009 | 22,736 | 21,829 | 21,334 | 23,200 | 21,870 | 22,871 | 21,703 | 20,111 | 19,773 | 19,676 | 129 | 127 |
| 2 | Investments in and Advance to Affiliates + | 783 | 2,408 | 2,482 | 2,472 | 2,505 | 2,594 | 4,521 | 4,518 | 405 | 472 | 468 | 463 | 345 | 0 | 0 |
| 3 | Cash and Cash Equivalents + | 147 | 241 | 4,231 | 260 | 341 | 264 | 298 | 208 | 646 | 220 | 199 | 740 | 167 | 129 | 127 |
| 4 | Property + | 22,362 | 20,945 | 14,044 | 13,057 | 12,307 | 11,537 | 10,502 | 9,593 | 13,597 | 12,402 | 11,732 | 10,788 | 10,296 | 0 | 0 |
| 5 | Property + | 32,514 | 30,685 | 20,267 | 19,031 | 17,831 | 16,650 | 15,358 | 14,138 | 18,377 | 16,868 | 16,005 | 0 | 0 | 0 | 0 |
| 6 | Intangible Assets + | 50 | 321 | 65 | 74 | 49 | 0 | 0 | 0 | 0 | 0 | 0 | 0 | 0 | 0 | 0 |
| 7 | Finite-Lived Intangible Assets + | 50 | 321 | 65 | 74 | 49 | 0 | 0 | 0 | 0 | 0 | 0 | 0 | 0 | 0 | 0 |
| 8 | Liabilities and Equity + | 33,471 | 35,439 | 27,009 | 22,736 | 21,829 | 21,334 | 23,200 | 21,870 | 22,871 | 21,703 | 20,111 | 19,773 | 19,676 | 1,811 | 0 |
| 9 | Liabilities + | 4,849 | 3,888 | 3,302 | 3,108 | 3,115 | 2,507 | 3,528 | 9,767 | 10,251 | 8,902 | 7,965 | 8,070 | 7,626 | 0 | 0 |
| 10 | Debt and Lease Obligation + | 24 | 0 | 0 | 39 | 35 | 40 | 53 | 43 | 38 | 62 | 53 | 55 | 153 | 0 | 0 |
| 11 | Stockholders' Equity + | 8,348 | 8,359 | 8,058 | 4,688 | 3,460 | 3,461 | 4,548 | 4,329 | 4,301 | 4,222 | 3,198 | 2,639 | 2,022 | 1,811 | 0 |
| 12 | Stockholders' Equity Attributable to Parent + | 8,348 | 8,359 | 8,058 | 4,688 | 3,460 | 3,461 | 4,548 | 4,329 | 4,301 | 4,222 | 3,198 | 2,639 | 2,022 | 1,811 | 0 |
| 13 | Stockholders' Equity + | 0.01 | 0.02 | 0.02 | 0.02 | 0.02 | 0.02 | 0.02 | 0.02 | 0.02 | 0.02 | 0.02 | 0.02 | 0 | 0 | 0 |
| 14 | Preferred Stock + | 0 | 0.01 | 0.01 | 0.01 | 0.01 | 0.01 | 0.01 | 0.01 | 0.01 | 0.01 | 0.01 | 0.01 | 0 | 0 | 0 |
| 15 | Common Stock + | 0.01 | 0.01 | 0.01 | 0.01 | 0.01 | 0.01 | 0.01 | 0.01 | 0.01 | 0.01 | 0.01 | 0.01 | 0 | 0 | 0 |
| 16 | Partners' Capital + | -845 | 632 | 349 | 543 | -668 | -657 | -85 | -88 | -132 | 0 | 0 | 0 | 0 | 0 | 0 |
| 17 | Partners' Capital + | -845 | 632 | 349 | 543 | -668 | -657 | -85 | -88 | -132 | 0 | 0 | 0 | 0 | 0 | 0 |
| 18 | Limited Liability Company (LLC) Members' Equity + | -935 | 534 | 241 | 475 | -739 | -723 | 0 | 0 | 0 | 0 | 0 | 0 | 0 | 0 | 0 |
| 19 | Limited Liability Company (LLC) Members' Equity + | -935 | 534 | 241 | 475 | -739 | -723 | 0 | 0 | 0 | 0 | 0 | 0 | 0 | 0 | 0 |
| 20 | Current Assets + | 2,920 | 3,847 | 7,025 | 3,395 | 2,923 | 2,689 | 3,268 | 2,658 | 2,874 | 2,337 | 2,582 | 2,904 | 3,035 | 0 | 0 |
| 21 | Cash + | 871 | 822 | 540 | 960 | 953 | 805 | 930 | 767 | 540 | 386 | 367 | 300 | 218 | 0 | 0 |
| 22 | Current Receivables + | 505 | 586 | 378 | 427 | 335 | 279 | 357 | 398 | 339 | 326 | 835 | 790 | 1,009 | 0 | 0 |
| 23 | Inventory + | 297 | 269 | 200 | 175 | 181 | 179 | 0 | 285 | 322 | 353 | 375 | 327 | 569 | 0 | 0 |
| 24 | Current Contract with Customer + | 27 | 61 | 0 | 0 | 0 | 0 | 0 | 0 | 0 | 0 | 0 | 0 | 0 | 0 | 0 |
| 25 | Derivative Instruments and Hedges + | 0 | 136 | 100 | 110 | 51 | 89 | 99 | 24 | 36 | 87 | 54 | 39 | 118 | 0 | 0 |
| 26 | Current Disposal Group + | 0 | 1,002 | 0 | 0 | 0 | 0 | 0 | 0 | 0 | 0 | 0 | 0 | 0 | 0 | 0 |
| 27 | Long-Term Assets + | 4,980 | 5,443 | 1,090 | 1,058 | 1,035 | 986 | 987 | 9,619 | 6,400 | 6,964 | 5,797 | 6,081 | 6,345 | 0 | 0 |
| 28 | Long-Term Disposal Group + | 0 | 1,866 | 0 | 0 | 0 | 0 | 0 | 0 | 0 | 0 | 0 | 0 | 0 | 0 | 0 |
| 29 | Long-Term Derivative Instruments and Hedges + | 0 | 58 | 38 | 44 | 19 | 36 | 32 | 10 | 6 | 20 | 15 | 15 | 20 | 0 | 0 |
| 30 | Current Liabilities + | 4,825 | 3,888 | 3,302 | 3,069 | 3,080 | 2,467 | 3,475 | 3,019 | 3,575 | 2,593 | 2,620 | 3,038 | 2,848 | 0 | 0 |
| 31 | Long-Term Liabilities + | 28,368 | 31,442 | 18,576 | 17,800 | 16,865 | 16,955 | 16,634 | 6,705 | 6,638 | 6,247 | 5,292 | 4,977 | 4,625 | 0 | 0 |
| 32 | Current Other Assets + | 0 | 0 | 0 | 0 | 0 | 0 | 0 | 0 | 216 | 192 | 274 | 223 | 413 | 0 | 0 |
| 33 | Current Regulatory Assets + | 0 | 0 | 0 | 130 | 70 | 0 | 0 | 0 | 0 | 0 | 0 | 0 | 0 | 0 | 0 |
| 34 | Total Current Assets + | 2,920 | 3,847 | 7,025 | 3,395 | 2,923 | 2,689 | 3,268 | 2,658 | 2,874 | 2,337 | 2,582 | 2,904 | 3,035 | 0 | 0 |
| 35 | Operating Lease + | 31 | 63 | 0 | 0 | 0 | 0 | 0 | 0 | 0 | 0 | 0 | 0 | 0 | 0 | 0 |
| 36 | Goodwill + | 4,697 | 5,164 | 867 | 867 | 862 | 840 | 840 | 840 | 1,468 | 1,696 | 1,696 | 1,696 | 1,696 | 0 | 0 |
| 37 | Long-Term Other Assets + | 252 | 216 | 223 | 191 | 173 | 986 | 987 | 1,002 | 1,665 | 1,853 | 1,868 | 1,926 | 1,973 | 0 | 0 |
| 38 | Long-Term Regulated Entity + | 2,784 | 2,967 | 3,094 | 4,012 | 4,722 | 5,639 | 3,527 | 3,726 | 4,324 | 4,619 | 3,446 | 3,677 | 3,684 | 0 | 0 |
| 39 | Total Long-Term Assets + | 0 | 0 | 0 | 0 | 0 | 0 | 0 | 9,619 | 6,400 | 6,964 | 5,797 | 6,081 | 6,345 | 0 | 0 |
| 40 | Total Assets + | 33,471 | 35,439 | 27,009 | 22,736 | 21,829 | 21,334 | 23,200 | 21,870 | 22,871 | 21,703 | 20,111 | 19,773 | 19,676 | 0 | 0 |
| 41 | Total Liabilities and Equity + | 33,471 | 35,439 | 27,009 | 22,736 | 21,829 | 21,334 | 23,200 | 21,870 | 22,871 | 21,703 | 20,111 | 19,773 | 19,676 | 0 | 0 |
Year | 2020 | 2019 | 2018 | 2017 | 2016 | 2015 | 2014 | 2013 | 2012 | 2011 | 2010 | 2009 | 2008 | 2007 | |
|---|---|---|---|---|---|---|---|---|---|---|---|---|---|---|---|
| 1 | 6 | 6 | 0 | 0 | 0 | 0 | 0 | 0 | 0 | 0 | 0 | 0 | 0 | 0 | |
| 2 | 7,418 | 12,301 | 10,589 | 9,614 | 7,528 | 7,386 | 9,226 | 8,106 | 7,452 | 8,450 | 8,785 | 8,281 | 11,322 | 9,623 | |
| 3 | -257 | -4,029 | -4,364 | -3,785 | -1,983 | 0 | 0 | 0 | 0 | 0 | 0 | 0 | 0 | 0 | |
| 4 | 0 | 0 | 0 | 0 | 0 | 0 | 0 | 0 | 0 | 529 | 531 | 496 | 0 | 0 | |
| 5 | 0 | 0 | 0 | 0 | 0 | 0 | 0 | 0 | 0 | 886 | 864 | 743 | 708 | 631 | |
| 6 | 0 | 0 | 0 | 0 | 0 | 0 | 0 | 0 | 0 | 0 | 0 | -3 | 0 | -32 | |
| 7 | 16 | 16 | 10 | 8 | 10 | 6 | 5 | 5 | 7 | 5 | 5 | 0 | 0 | 0 | |
| 8 | 24 | 16 | 16 | 14 | 7 | 19 | 22 | 21 | 16 | 26 | 30 | 36 | 0 | 0 | |
| 9 | 0 | 0 | 0 | 0 | 0 | 0 | 0 | 0 | 0 | 0 | 21 | 0 | 0 | 0 | |
| 10 | 0 | 0 | 0 | 0 | 0 | 0 | 0 | -7,096 | -6,414 | -7,152 | -7,536 | -7,157 | -10,049 | -8,438 | |
| 11 | 1,039 | 1,226 | 831 | 1,072 | 959 | 933 | 935 | 1,010 | 1,038 | 1,298 | 1,249 | 1,124 | 1,273 | 1,185 | |
| 12 | -60 | -78 | -123 | 188 | -361 | 103 | -40 | -172 | -91 | -7 | 0 | 0 | 0 | 0 | |
| 13 | 60 | 50 | 50 | 60 | 35 | 46 | 36 | 24 | 38 | 23 | 12 | 39 | 14 | 17 | |
| 14 | -1,904 | -297 | -317 | -9 | -273 | -2,063 | -50 | -229 | -281 | -124 | -544 | -576 | -550 | -597 | |
| 15 | 0 | 5 | 0 | 0 | 0 | 0 | 0 | 0 | 0 | 0 | 0 | 0 | 0 | 0 | |
| 16 | 0 | 0 | 0 | 0 | 0 | 0 | 0 | 0 | 0 | 0 | 0 | 3 | 0 | 27 | |
| 17 | 2 | 0 | 0 | 0 | 0 | 0 | 0 | 0 | 0 | 0 | 0 | 0 | 0 | 0 | |
| 18 | -501 | -528 | -361 | -313 | -338 | -352 | -353 | -351 | -422 | -456 | -481 | -513 | -468 | -509 | |
| 19 | 0 | 0 | 0 | 0 | 0 | 0 | 0 | 781 | 757 | 1,174 | 705 | 548 | 723 | 588 | |
| 20 | -1,428 | 230 | 307 | 265 | 208 | -1,633 | 308 | 188 | 31 | 30 | 29 | 15 | 51 | 16 | |
| 21 | -865 | 929 | 514 | 1,063 | 686 | -1,130 | 885 | 781 | 757 | 1,174 | 705 | 548 | 0 | 0 | |
| 22 | 274 | -138 | -146 | 729 | -254 | 438 | -274 | -470 | -340 | -404 | -263 | -176 | -277 | -193 | |
| 23 | 37 | 155 | -37 | 0 | 0 | 0 | 0 | 0 | 0 | 0 | 0 | 0 | 0 | 0 | |
| 24 | 16 | 109 | -28 | 0 | 0 | 0 | 0 | 0 | 0 | 0 | 0 | 0 | 0 | 0 | |
| 25 | Total Net Income (Loss) Attributable to Parent + | -773 | 791 | 368 | 1,792 | 432 | -692 | 611 | 311 | 417 | 1,357 | 442 | 372 | 446 | 395 |
| 26 | Preferred Stock Dividends + | 144 | 117 | 35 | 0 | 0 | 0 | 0 | 0 | 0 | 0 | 0 | 0 | 0 | 0 |
| 27 | Total Preferred Stock Dividends and Other Adjustments + | -176 | -117 | -35 | 0 | 0 | 0 | 0 | 0 | 0 | 0 | 0 | 0 | 0 | 0 |
| 28 | -949 | 674 | 333 | 1,792 | 432 | 0 | 0 | 0 | 0 | 0 | 0 | 0 | 0 | 0 | |
| 29 | Total Income (Loss) from Continuing Operations + | -591 | 682 | 396 | 0 | 0 | 0 | 0 | 0 | 0 | 0 | 0 | 0 | 0 | 0 |
| 30 | Total Income (Loss) from Discontinued Operations + | -182 | 109 | -28 | 0 | 0 | 0 | 0 | 0 | 0 | 0 | 0 | 0 | 0 | 0 |
| 31 | Income (Loss) from Continuing Operations + | -1.45 | 1.12 | 0.80 | 0 | 0 | 0 | 0 | 0.73 | 0.98 | 1.81 | 1.08 | 0 | 0 | 0 |
| 32 | -0.34 | 0.22 | -0.06 | 0 | 0 | 0 | 0 | 0 | 0 | 0 | 0 | 0 | 0 | 0 | |
| 33 | Total Earnings Per Share + | -1.79 | 1.34 | 0.74 | 4.16 | 1 | -1.61 | 1.42 | 0.73 | 0.98 | 3.19 | 1.08 | 1.02 | 1.32 | 1.23 |
| 34 | Income (Loss) from Continuing Operations + | -1.45 | 1.12 | 0.80 | 0 | 0 | 0 | 0 | 0.73 | 0.98 | 1.81 | 1.08 | 0 | 0 | 0 |
| 35 | Income (Loss) from Continuing Operations + | -1.45 | 1.12 | 0.80 | 0 | 0 | 0 | 0 | 0.72 | 0.97 | 1.80 | 1.07 | 0 | 0 | 0 |
| 36 | -0.34 | 0.21 | -0.06 | 0 | 0 | 0 | 0 | 0 | 0 | 0 | 0 | 0 | 0 | 0 | |
| 37 | Total Earnings Per Share + | -1.79 | 1.33 | 0.74 | 4.13 | 1 | -1.61 | 1.42 | 0.72 | 0.97 | 3.17 | 1.07 | 1.01 | 1.30 | 1.15 |
| 38 | 0 | 0.86 | 1.12 | 0.28 | 1.03 | 0.99 | 0.95 | 0.83 | 0.81 | 0.79 | 0.78 | 0.76 | 0 | 0 | |
| 39 | 0 | 0 | 0 | 1.35 | 2.06 | 1.98 | 0 | 0 | 0 | 0 | 0 | 0 | 0 | 0 | |
| 40 | 37 | 155 | -37 | 0 | 0 | 0 | 0 | 0 | 0 | 0 | 0 | 0 | 0 | 0 |

 Click to Enlarge