| Date | Price $ | Result % | Candle Name | Side |
|---|---|---|---|---|
| 001 22 Mar 2024 | Sell Price: 141.16 | Profit: Open Day1 ($ 140.15) | Engulfing | Sell |
| 002 14 Mar 2024 | Sell Price: 139.43 | Profit: Open Day1 ($ 137.10) | Abandoned Baby | Sell |
| 003 08 Feb 2024 | Buy Price: 135.38 | Profit: Open Day2 ($ 135.60) | Engulfing | Buy |
| 004 02 Jan 2024 | Buy Price: 132.11 | Loss: Close Day2 ($ 129.77) | Engulfing | Buy |
| 005 20 Dec 2023 | Sell Price: 127.73 | Loss: Close Day2 ($ 129.73) | Engulfing | Sell |
| 006 01 Nov 2023 | Sell Price: 100.27 | Loss: Close Day2 ($ 106.32) | Engulfing | Sell |
| 007One Year Average | Both Sides Result for 6 Signals |
Loss: $ -6.83 ($ -1.14 / Signal) |
All of Them | Buy + Sell |
| Simple Moving Averages (SMA) Period | Value $ | Signal | Exponential Moving Averages (EMA) Period | Value $ | Signal | |
|---|---|---|---|---|---|---|
| 2 | 147.42 | SELL | 2 | 146.73 | SELL | |
| 3 | 147.58 | SELL | 3 | 146.71 | SELL | |
| 5 | 146.58 | SELL | 5 | 145.96 | BUY | |
| 8 | 143.46 | BUY | 8 | 144.86 | BUY | |
| 13 | 142.33 | BUY | 13 | 143.81 | BUY | |
| 21 | 143.16 | BUY | 21 | 142.84 | BUY | |
| 34 | 141.72 | BUY | 34 | 141.51 | BUY | |
| 55 | 139.55 | BUY | 55 | 139.05 | BUY | |
| 90 | 136.41 | BUY | 90 | 134.50 | BUY | |
| 200 | 119.23 | BUY | 200 | 124.38 | BUY |
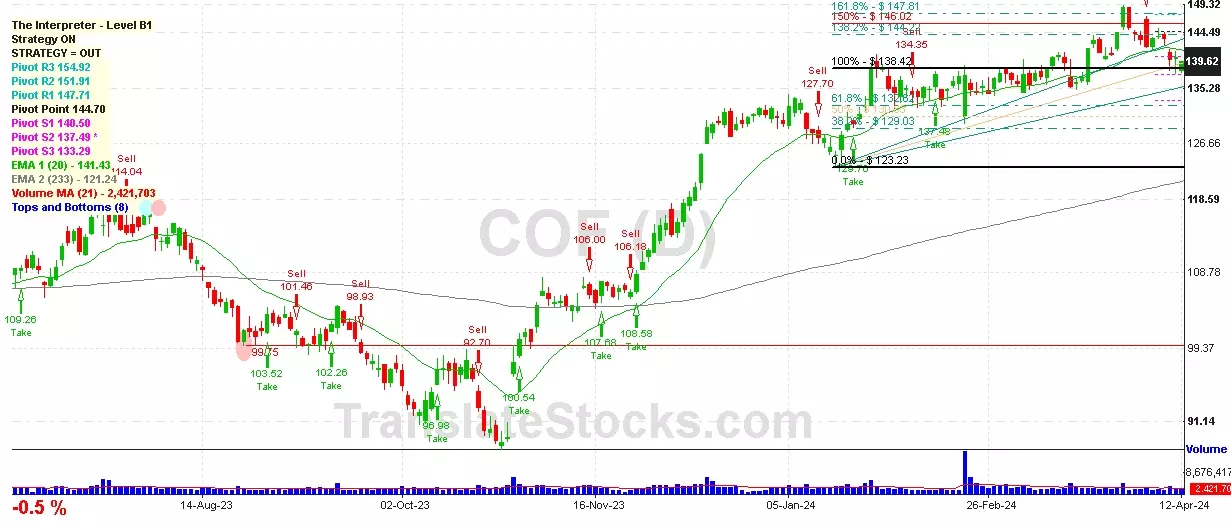
Capital One Financial Corp
IPO: 1994-11-16
Ticker: COFIndices: S&P 500,
Exchange: New York Stock Exchange, Inc. (US - USD)
Website: https://www.capitalone.com
Phone:
Common Stock
Finance (
National Commercial Banks

 Click to Enlarge