| Date | Price $ | Result % | Candle Name | Side | No Candlesticks to Show Yet. |
|---|
| Simple Moving Averages (SMA) Period | Value $ | Signal | Exponential Moving Averages (EMA) Period | Value $ | Signal | |
|---|---|---|---|---|---|---|
| 2 | 22.69 | SELL | 2 | 22.67 | SELL | |
| 3 | 22.75 | SELL | 3 | 22.74 | SELL | |
| 5 | 22.88 | SELL | 5 | 22.84 | SELL | |
| 8 | 23.03 | SELL | 8 | 22.85 | SELL | |
| 13 | 23.01 | SELL | 13 | 22.71 | SELL | |
| 21 | 22.16 | BUY | 21 | 22.39 | BUY | |
| 34 | 21.78 | BUY | 34 | 21.97 | BUY | |
| 55 | 21.10 | BUY | 55 | 21.52 | BUY | |
| 90 | 21.09 | BUY | 90 | 20.97 | BUY | |
| 200 | 19.08 | BUY | 200 | 19.85 | BUY |
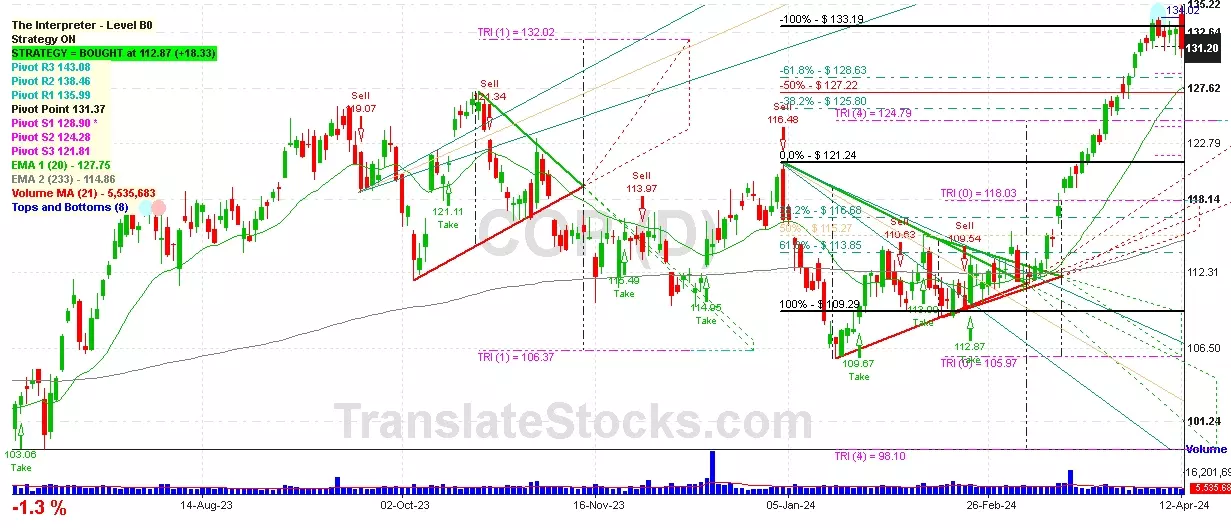
Cabot Oil & Gas Corp
IPO: 1990-08-02
Ticker: COGIndices: S&P 500,
Exchange: New York Stock Exchange, Inc. (US - USD)
Website: http://www.cabotog.com
Phone:
Common Stock
Energy & Transportation (
Crude Petroleum & Natural Gas

 Click to Enlarge
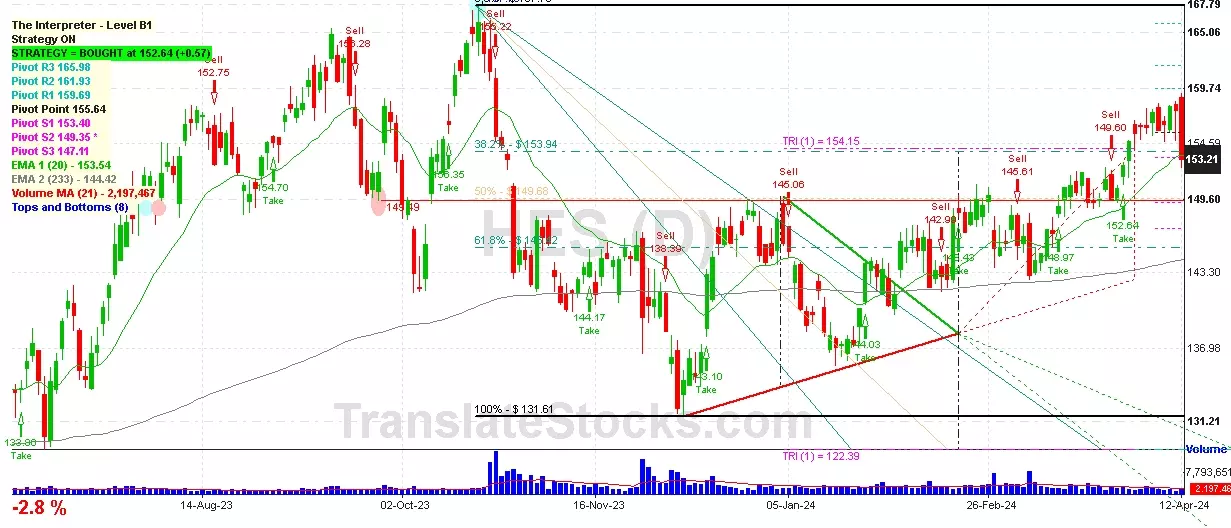