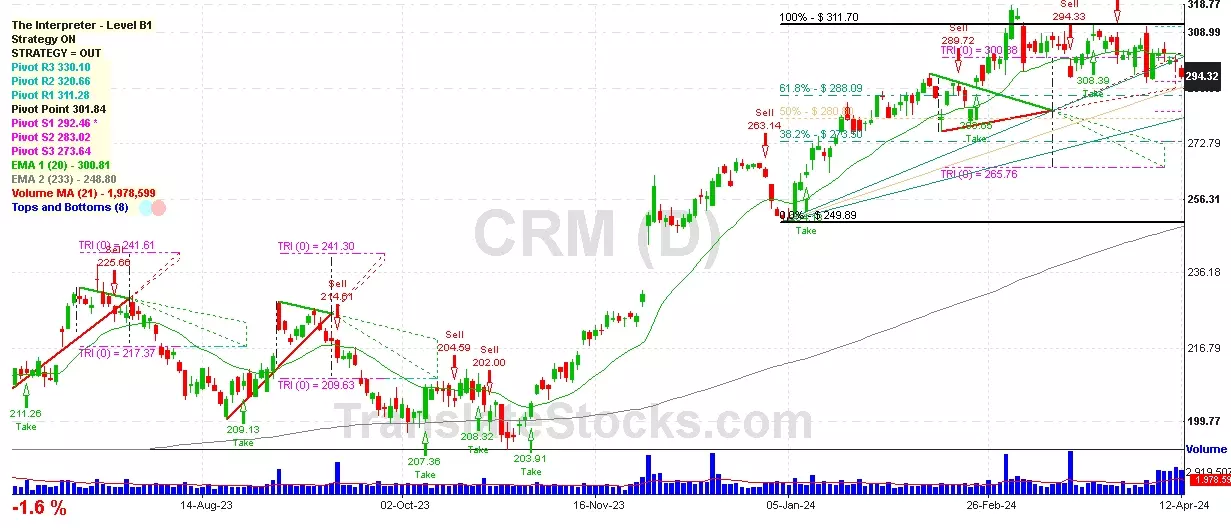
Hey Friend, I'm analysing SALESFORCE COM INC (CRM), and it is between the Support of $ 292.46 (PivotS1) and the Resistance of $ 300.38 (Triangle Projection Level 0). The stock is also approaching the line of PivotS1 at $ 292.46, and if it goes below this line it could reach the next Support of 61.8% of Fibonacci at $ 288.09.

| Date | Price $ | Result % | Candle Name | Side |
|---|---|---|---|---|
| 001 10 Apr 2024 | Sell Price: 299.62 | Profit: Open Day1 ($ 299.47) | Abandoned Baby | Sell |
| 002 01 Apr 2024 | Buy Price: 302.26 | Profit: Close Day1 ($ 304.00) | Abandoned Baby | Buy |
| 003 22 Mar 2024 | Sell Price: 307.77 | Profit: Open Day1 ($ 303.70) | Engulfing | Sell |
| 004 18 Mar 2024 | Buy Price: 300.51 | Profit: Close Day1 ($ 301.45) | Abandoned Baby | Buy |
| 005 23 Feb 2024 | Sell Price: 292.80 | Loss: Close Day2 ($ 299.50) | Dark Cloud Cover | Sell |
| 006 16 Feb 2024 | Sell Price: 289.72 | Profit: Open Day1 ($ 289.50) | Engulfing | Sell |
| 007 17 Jan 2024 | Buy Price: 271.44 | Profit: Open Day1 ($ 273.00) | Engulfing | Buy |
| 008 08 Jan 2024 | Buy Price: 260.87 | Profit: Close Day1 ($ 261.34) | Abandoned Baby | Buy |
| 009 18 Aug 2023 | Buy Price: 204.83 | Profit: Open Day1 ($ 206.00) | Piercing Line | Buy |
| 010 01 Jun 2023 | Sell Price: 212.90 | Profit: Open Day2 ($ 210.47) | Abandoned Baby | Sell |
| 011One Year Average | Both Sides Result for 10 Signals |
Profit: $ 6.05 ($ 0.60 / Signal) |
All of Them | Buy + Sell |
| Simple Moving Averages (SMA) Period | Value $ | Signal | Exponential Moving Averages (EMA) Period | Value $ | Signal | |
|---|---|---|---|---|---|---|
| 2 | 276.43 | SELL | 2 | 275.94 | BUY | |
| 3 | 275.56 | BUY | 3 | 275.60 | BUY | |
| 5 | 273.79 | BUY | 5 | 275.93 | BUY | |
| 8 | 274.45 | BUY | 8 | 278.05 | SELL | |
| 13 | 284.06 | SELL | 13 | 282.13 | SELL | |
| 21 | 290.87 | SELL | 21 | 286.78 | SELL | |
| 34 | 295.92 | SELL | 34 | 289.85 | SELL | |
| 55 | 295.59 | SELL | 55 | 288.54 | SELL | |
| 90 | 285.58 | SELL | 90 | 280.63 | SELL | |
| 200 | 248.06 | BUY | 200 | 255.71 | BUY |
Common Stock
Technology (
Services-prepackaged Software
 Click to Enlarge