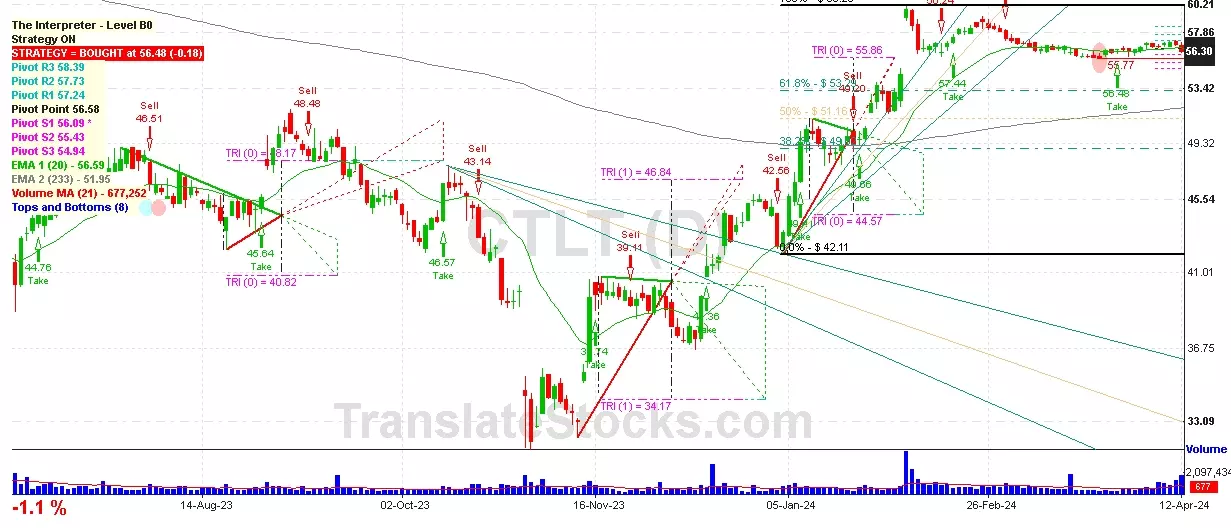
Hey Friend, I'm analysing CATALENT INC (CTLT), and it is between the Support of $ 56.09 (PivotS1) and the Resistance of $ 56.58 (Pivot). The stock is also approaching the line of PivotS1 at $ 56.09, and if it goes below this line it could reach the next Support of Triangle projection at $55.86.

| Date | Price $ | Result % | Candle Name | Side |
|---|---|---|---|---|
| 001 05 Apr 2024 | Sell Price: 56.75 | Profit: Close Day1 ($ 56.69) | Engulfing | Sell |
| 002 11 Dec 2023 | Buy Price: 37.97 | Profit: Close Day2 ($ 39.65) | Abandoned Baby | Buy |
| 003 11 Dec 2023 | Buy Price: 37.93 | Profit: Close Day2 ($ 39.65) | Engulfing | Buy |
| 004 14 Nov 2023 | Buy Price: 35.53 | Profit: Open Day1 ($ 36.11) | Abandoned Baby | Buy |
| 005 11 Sep 2023 | Buy Price: 49.02 | Loss: Close Day2 ($ 48.84) | Engulfing | Buy |
| 006 15 Aug 2023 | Buy Price: 45.43 | Loss: Close Day2 ($ 44.20) | Piercing Line | Buy |
| 007 31 May 2023 | Buy Price: 37.23 | Profit: Open Day2 ($ 37.82) | Engulfing | Buy |
| 008One Year Average | Both Sides Result for 7 Signals |
Profit: $ 3.22 ($ 0.46 / Signal) |
All of Them | Buy + Sell |
| Simple Moving Averages (SMA) Period | Value $ | Signal | Exponential Moving Averages (EMA) Period | Value $ | Signal | |
|---|---|---|---|---|---|---|
| 2 | 55.99 | SELL | 2 | 55.96 | SELL | |
| 3 | 56.01 | SELL | 3 | 55.95 | BUY | |
| 5 | 55.86 | BUY | 5 | 55.95 | SELL | |
| 8 | 55.89 | BUY | 8 | 56.01 | SELL | |
| 13 | 56.24 | SELL | 13 | 56.11 | SELL | |
| 21 | 56.36 | SELL | 21 | 56.21 | SELL | |
| 34 | 56.32 | SELL | 34 | 56.07 | SELL | |
| 55 | 56.76 | SELL | 55 | 55.18 | BUY | |
| 90 | 53.32 | BUY | 90 | 53.33 | BUY | |
| 200 | 47.93 | BUY | 200 | 51.54 | BUY |
Catalent Inc
IPO: 2014-07-31
Ticker: CTLTIndices: S&P 500,
Exchange: New York Stock Exchange, Inc. (US - USD)
Website: https://www.catalent.com/
Phone:
Common Stock
Life Sciences (
Pharmaceutical Preparations
 Click to Enlarge