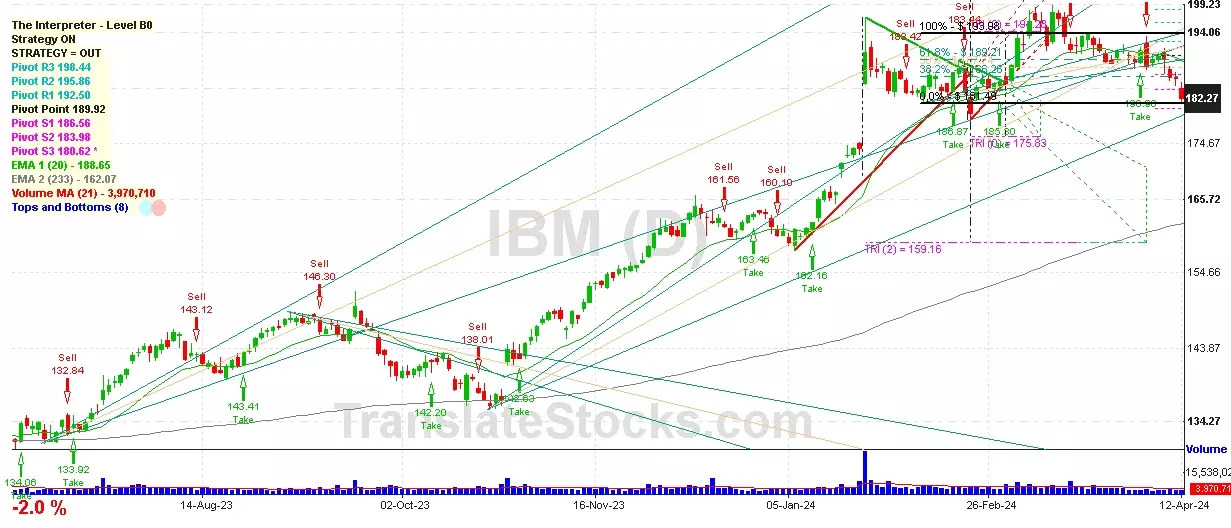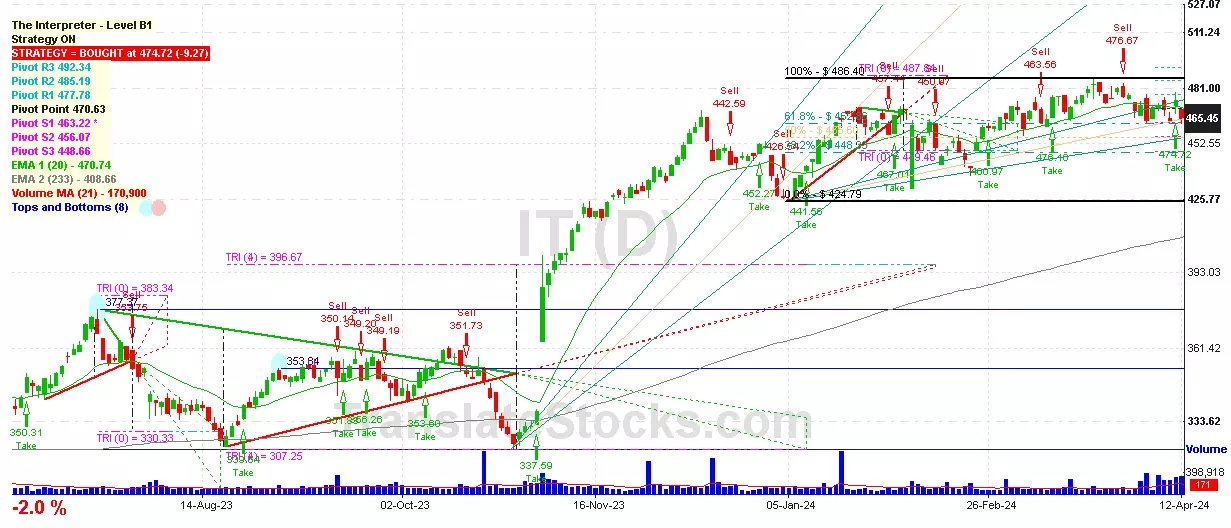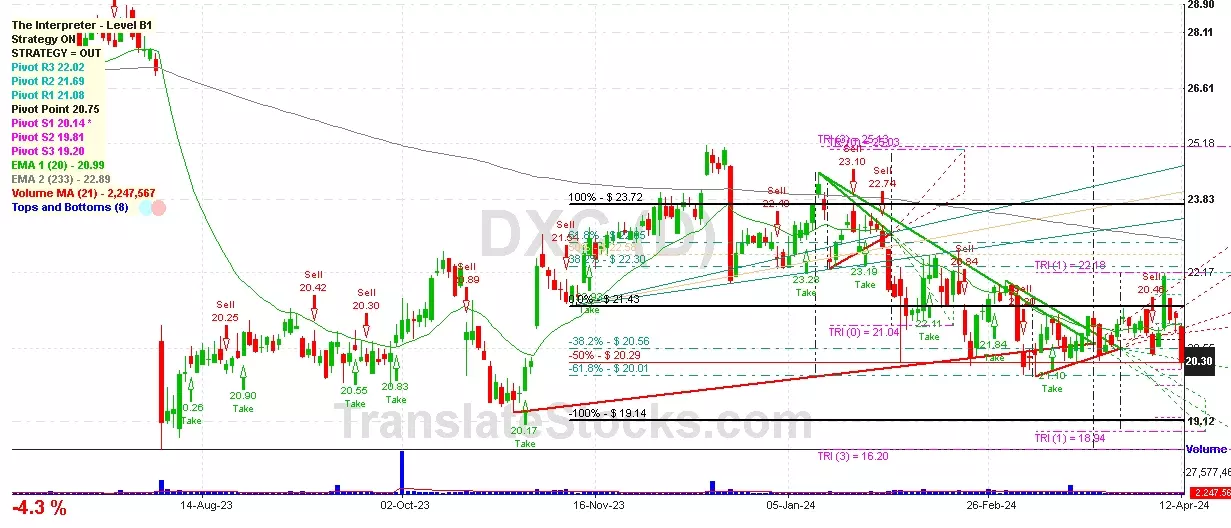
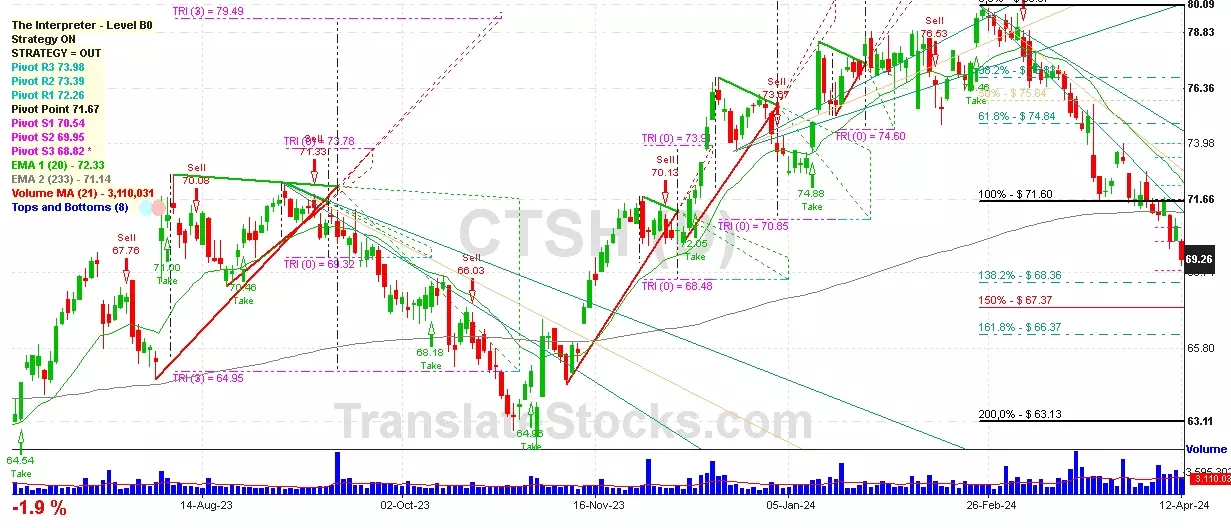
Hey Friend, I'm analysing COGNIZANT TECH SOLUTIONS A (CTSH), and it is between the Support of $ 68.82 (PivotS3) and the Resistance of $ 69.32 (Triangle Projection Level 0). The stock is also approaching the line of PivotS3 at $ 68.82, and if it goes below this line it could reach the next Support of Triangle projection at $68.48.

| Date | Price $ | Result % | Candle Name | Side |
|---|---|---|---|---|
| 001 09 Apr 2024 | Buy Price: 71.51 | Loss: Close Day2 ($ 70.57) | Abandoned Baby | Buy |
| 002 09 Apr 2024 | Buy Price: 71.56 | Loss: Close Day2 ($ 70.57) | Engulfing | Buy |
| 003 11 Dec 2023 | Buy Price: 71.68 | Profit: Open Day1 ($ 71.75) | Abandoned Baby | Buy |
| 004 30 Oct 2023 | Buy Price: 63.75 | Profit: Open Day1 ($ 63.93) | Abandoned Baby | Buy |
| 005 05 Sep 2023 | Sell Price: 70.97 | Profit: Open Day1 ($ 70.85) | Abandoned Baby | Sell |
| 006 03 Aug 2023 | Buy Price: 70.47 | Profit: Open Day1 ($ 70.83) | Abandoned Baby | Buy |
| 007 10 May 2023 | Buy Price: 62.56 | Loss: Close Day2 ($ 61.66) | Abandoned Baby | Buy |
| 008 02 May 2023 | Sell Price: 59.38 | Profit: Close Day1 ($ 58.88) | Engulfing | Sell |
| 009 27 Apr 2023 | Buy Price: 59.21 | Profit: Open Day1 ($ 59.36) | Abandoned Baby | Buy |
| 010One Year Average | Both Sides Result for 9 Signals |
Loss: $ -1.45 ($ -0.16 / Signal) |
All of Them | Buy + Sell |
| Simple Moving Averages (SMA) Period | Value $ | Signal | Exponential Moving Averages (EMA) Period | Value $ | Signal | |
|---|---|---|---|---|---|---|
| 2 | 67.99 | SELL | 2 | 67.83 | SELL | |
| 3 | 67.80 | SELL | 3 | 67.81 | SELL | |
| 5 | 67.62 | BUY | 5 | 67.91 | SELL | |
| 8 | 67.96 | SELL | 8 | 68.27 | SELL | |
| 13 | 69.08 | SELL | 13 | 69.02 | SELL | |
| 21 | 70.29 | SELL | 21 | 70.16 | SELL | |
| 34 | 72.33 | SELL | 34 | 71.56 | SELL | |
| 55 | 74.51 | SELL | 55 | 72.69 | SELL | |
| 90 | 74.96 | SELL | 90 | 72.97 | SELL | |
| 200 | 71.41 | SELL | 200 | 71.34 | SELL |
Cognizant Tech Solutions-a
IPO: 1998-06-24
Ticker: CTSHIndices: S&P 500,
Nasdaq 100,
Exchange: Nasdaq Nms - Global Market (US - USD)
Website: https://www.cognizant.com/
Phone:
Common Stock
Technology (
Services-computer Programming Services
 Click to Enlarge