
| Date | Price $ | Result % | Candle Name | Side |
|---|---|---|---|---|
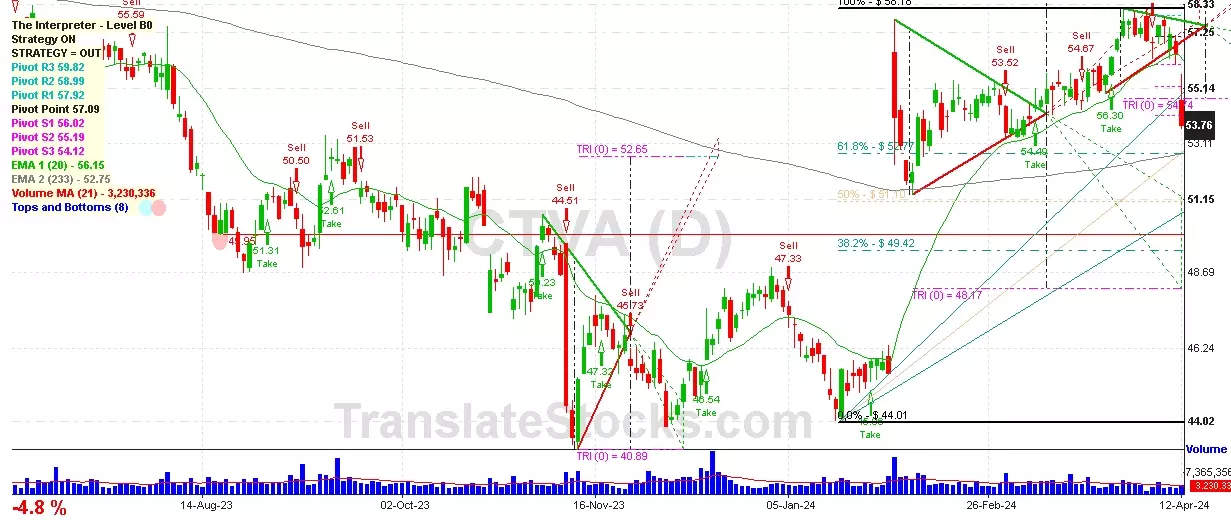
| 001 08 Apr 2024 | Buy Price: 57.52 | Profit: Open Day1 ($ 57.73) | Abandoned Baby | Buy |
| 002 20 Feb 2024 | Sell Price: 54.36 | Profit: Open Day1 ($ 54.22) | Abandoned Baby | Sell |
| 003 02 Jan 2024 | Buy Price: 48.56 | Loss: Close Day2 ($ 47.59) | Engulfing | Buy |
| 004 29 Dec 2023 | Sell Price: 47.92 | Profit: Open Day1 ($ 47.83) | Abandoned Baby | Sell |
| 005 06 Oct 2023 | Buy Price: 50.05 | Profit: Close Day1 ($ 50.59) | Piercing Line | Buy |
| 006 15 Sep 2023 | Sell Price: 52.55 | Profit: Open Day1 ($ 52.44) | Abandoned Baby | Sell |
| 007 05 Sep 2023 | Sell Price: 50.96 | Profit: Open Day1 ($ 50.85) | Engulfing | Sell |
| 008 12 May 2023 | Buy Price: 57.02 | Profit: Open Day1 ($ 57.23) | Abandoned Baby | Buy |
| 009 02 May 2023 | Sell Price: 60.64 | Profit: Close Day1 ($ 60.00) | Abandoned Baby | Sell |
| 010One Year Average | Both Sides Result for 9 Signals |
Profit: $ 1.08 ($ 0.12 / Signal) |
All of Them | Buy + Sell |
| Simple Moving Averages (SMA) Period | Value $ | Signal | Exponential Moving Averages (EMA) Period | Value $ | Signal | |
|---|---|---|---|---|---|---|
| 2 | 53.75 | BUY | 2 | 53.82 | BUY | |
| 3 | 53.60 | BUY | 3 | 53.84 | BUY | |
| 5 | 53.65 | BUY | 5 | 54.13 | SELL | |
| 8 | 54.92 | SELL | 8 | 54.61 | SELL | |
| 13 | 55.79 | SELL | 13 | 55.11 | SELL | |
| 21 | 56.01 | SELL | 21 | 55.32 | SELL | |
| 34 | 55.46 | SELL | 34 | 55.01 | SELL | |
| 55 | 54.76 | SELL | 55 | 54.09 | SELL | |
| 90 | 51.52 | BUY | 90 | 52.95 | BUY | |
| 200 | 51.08 | BUY | 200 | 52.63 | BUY |

 Click to Enlarge