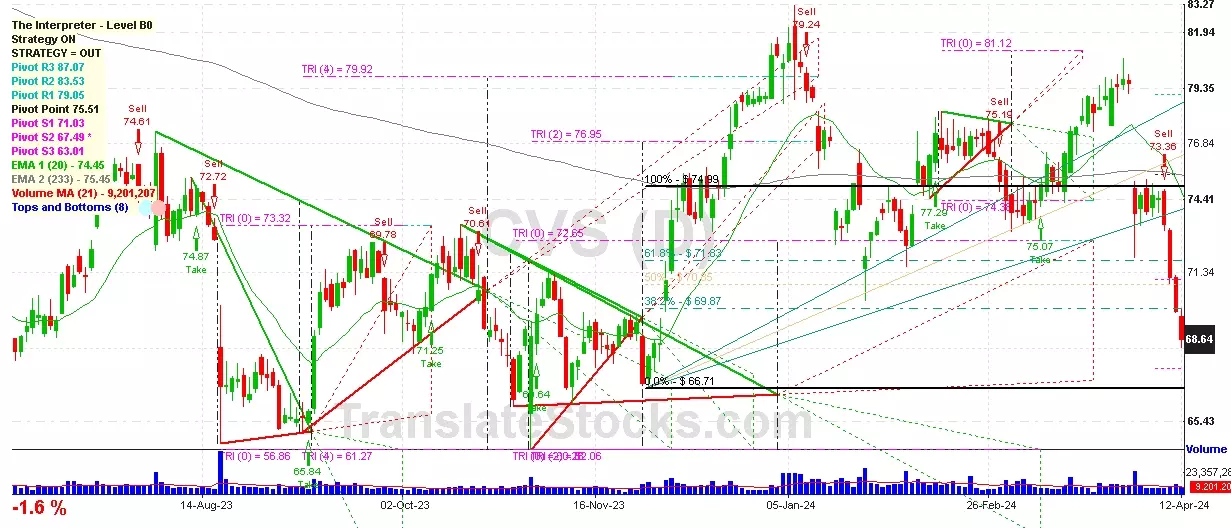
Hey Friend, I'm analysing CVS HEALTH CORP (CVS), and it is between the Support of $ 67.49 (PivotS2) and the Resistance of $ 69.87 (38.2% of Fibonacci). The stock is also approaching the line of PivotS2 at $ 67.49, and if it goes below this line it could reach the next Support of 0% of Fibonacci at $ 66.71.

| Date | Price $ | Result % | Candle Name | Side |
|---|---|---|---|---|
| 001 09 Feb 2024 | Buy Price: 76.32 | Profit: Close Day1 ($ 77.29) | Engulfing | Buy |
| 002 01 Feb 2024 | Sell Price: 73.92 | Profit: Close Day1 ($ 73.09) | Engulfing | Sell |
| 003 16 Oct 2023 | Sell Price: 71.49 | Profit: Open Day1 ($ 71.18) | Dark Cloud Cover | Sell |
| 004 11 Aug 2023 | Buy Price: 74.87 | Loss: Close Day2 ($ 73.33) | Engulfing | Buy |
| 005 10 Aug 2023 | Sell Price: 73.80 | Profit: Open Day1 ($ 73.76) | Engulfing | Sell |
| 006 10 Aug 2023 | Sell Price: 73.96 | Profit: Open Day1 ($ 73.76) | Dark Cloud Cover | Sell |
| 007 12 Jun 2023 | Sell Price: 71.50 | Profit: Open Day2 ($ 68.27) | Abandoned Baby | Sell |
| 008One Year Average | Both Sides Result for 7 Signals |
Profit: $ 4.03 ($ 0.58 / Signal) |
All of Them | Buy + Sell |
| Simple Moving Averages (SMA) Period | Value $ | Signal | Exponential Moving Averages (EMA) Period | Value $ | Signal | |
|---|---|---|---|---|---|---|
| 2 | 69.07 | SELL | 2 | 68.87 | SELL | |
| 3 | 69.29 | SELL | 3 | 69.02 | SELL | |
| 5 | 69.17 | SELL | 5 | 69.21 | SELL | |
| 8 | 69.06 | SELL | 8 | 69.66 | SELL | |
| 13 | 70.44 | SELL | 13 | 70.63 | SELL | |
| 21 | 73.10 | SELL | 21 | 71.90 | SELL | |
| 34 | 74.42 | SELL | 34 | 73.10 | SELL | |
| 55 | 74.90 | SELL | 55 | 73.88 | SELL | |
| 90 | 75.59 | SELL | 90 | 74.07 | SELL | |
| 200 | 72.73 | SELL | 200 | 74.60 | SELL |
Cvs Health Corp
IPO: 1952-10-01
Ticker: CVSIndices: S&P 500,
Exchange: New York Stock Exchange, Inc. (US - USD)
Website: https://cvshealth.com/
Phone:
Common Stock
Trade & Services (
Retail-drug Stores And Proprietary Stores
Year | 2020 | 2019 | 2018 | 2017 | 2016 | 2015 | 2014 | 2013 | 2012 | 2011 | 2010 | 2009 | 2008 | 2007 | 2006 | |
|---|---|---|---|---|---|---|---|---|---|---|---|---|---|---|---|---|
| 1 | Assets + | 230,715 | 222,449 | 196,456 | 95,131 | 94,462 | 93,657 | 74,252 | 71,526 | 66,221 | 64,852 | 62,169 | 61,641 | 60,960 | 1,056 | 530 |
| 2 | Real Estate Investment Property + | 0 | 0 | 0 | 0 | 0 | 0 | 0 | 0 | 0 | 0 | 1,247 | 1,076 | 0 | 0 | 0 |
| 3 | Real Estate Investment Property + | 0 | 0 | 0 | 0 | 0 | 0 | 0 | 0 | 0 | 0 | 1,247 | 1,076 | 0 | 0 | 0 |
| 4 | Cash and Cash Equivalents + | 7,854 | 5,683 | 4,059 | 1,696 | 3,371 | 2,459 | 2,481 | 4,089 | 1,375 | 1,413 | 1,427 | 1,086 | 1,352 | 1,056 | 530 |
| 5 | Property + | 12,606 | 12,044 | 11,349 | 10,292 | 10,175 | 9,855 | 8,843 | 8,615 | 8,632 | 8,467 | 8,322 | 7,923 | 8,125 | 0 | 0 |
| 6 | Property + | 31,306 | 28,934 | 26,869 | 24,290 | 22,802 | 21,036 | 18,786 | 17,408 | 16,306 | 15,400 | 14,283 | 12,944 | 0 | 0 | 0 |
| 7 | Intangible Assets + | 31,142 | 33,121 | 36,524 | 13,630 | 13,511 | 13,878 | 9,774 | 9,529 | 9,753 | 9,869 | 9,784 | 10,127 | 10,446 | 0 | 0 |
| 8 | Finite-Lived Intangible Assets + | -10,481 | -9,038 | -7,214 | -6,299 | -5,495 | -4,709 | -4,025 | -3,509 | 23,208 | 23,775 | 23,421 | 0 | 0 | 0 | 0 |
| 9 | Liabilities and Equity + | 230,715 | 222,449 | 196,456 | 95,131 | 94,462 | 93,657 | 74,252 | 71,526 | 66,221 | 64,543 | 62,169 | 61,641 | 60,960 | 31,322 | 0 |
| 10 | Liabilities + | 161,014 | 158,279 | 137,913 | 57,436 | 28,124 | 23,169 | 19,712 | 15,425 | 14,840 | 12,706 | 11,370 | 12,615 | 16,534 | 0 | 0 |
| 11 | Debt and Lease Obligation + | 0 | 0 | 720 | 1,276 | 1,874 | 0 | 685 | 0 | 690 | 750 | 300 | 315 | 3,044 | 0 | 0 |
| 12 | Temporary Equity + | 0 | 0 | 0 | 0 | 0 | 39 | 0 | 0 | 0 | 0 | 0 | 0 | 0 | 0 | 0 |
| 13 | Redeemable Noncontrolling Interest + | 0 | 0 | 0 | 0 | 0 | 39 | 0 | 0 | 0 | 0 | 0 | 0 | 0 | 0 | 0 |
| 14 | Stockholders' Equity + | 69,701 | 64,170 | 58,543 | 37,695 | 36,834 | 37,203 | 37,963 | 37,938 | 37,653 | 38,013 | 37,700 | 35,768 | 34,574 | 31,322 | 0 |
| 15 | Stockholders' Equity Attributable to Parent + | 69,389 | 63,864 | 58,225 | 37,691 | 36,830 | 37,196 | 37,958 | 37,938 | 37,653 | 16 | 37,700 | 35,768 | 34,574 | 31,322 | 0 |
| 16 | Stockholders' Equity + | 0.02 | 0.02 | 0.02 | 0.02 | 0.02 | 0.02 | 0.02 | 0.02 | 0.02 | 0.02 | 0.02 | 0.02 | 0.01 | 0 | 0 |
| 17 | Preferred Stock + | 0.01 | 0.01 | 0.01 | 0.01 | 0.01 | 0.01 | 0.01 | 0.01 | 0.01 | 0.01 | 0.01 | 0.01 | 0 | 0 | 0 |
| 18 | Common Stock + | 0.01 | 0.01 | 0.01 | 0.01 | 0.01 | 0.01 | 0.01 | 0.01 | 0.01 | 0.01 | 0.01 | 0.01 | 0.01 | 0 | 0 |
| 19 | Partners' Capital + | 49,640 | 45,108 | 40,911 | 43,556 | 38,983 | 35,506 | 31,849 | 28,493 | 24,998 | 22,090 | 19,303 | 16,355 | 13,098 | 0 | 0 |
| 20 | Partners' Capital + | 49,640 | 45,108 | 40,911 | 43,556 | 38,983 | 35,506 | 31,849 | 28,493 | 24,998 | 22,090 | 19,303 | 16,355 | 13,098 | 0 | 0 |
| 21 | Limited Liability Company (LLC) Members' Equity + | 51,054 | 46,127 | 41,013 | 43,391 | 38,678 | 35,148 | 31,632 | 28,344 | 24,817 | 21,918 | 19,160 | 16,220 | 12,955 | 0 | 0 |
| 22 | Limited Liability Company (LLC) Members' Equity + | 51,054 | 46,127 | 41,013 | 43,391 | 38,678 | 35,148 | 31,632 | 28,344 | 24,817 | 21,918 | 19,160 | 16,220 | 12,955 | 0 | 0 |
| 23 | Current Assets + | 56,369 | 50,302 | 45,243 | 31,229 | 31,042 | 30,378 | 25,983 | 25,325 | 20,161 | 18,594 | 17,706 | 17,537 | 16,526 | 0 | 0 |
| 24 | Cash + | 3,000 | 2,373 | 2,528 | 125 | 87 | 88 | 34 | 88 | 5 | 5 | 4 | 5 | 0 | 0 | 0 |
| 25 | Current Receivables + | 21,742 | 19,617 | 17,631 | 13,181 | 12,164 | 11,888 | 9,687 | 8,729 | 6,479 | 6,047 | 4,925 | 5,457 | 5,384 | 0 | 0 |
| 26 | Inventory + | 18,496 | 17,516 | 16,450 | 15,296 | 14,760 | 14,001 | 11,930 | 11,045 | 11,032 | 10,046 | 10,695 | 10,343 | 9,153 | 0 | 0 |
| 27 | Current Contract with Customer + | 7,101 | 6,717 | 6,896 | 7,895 | 0 | 0 | 0 | 0 | 0 | 0 | 0 | 0 | 0 | 0 | 0 |
| 28 | Long-Term Assets + | 104,905 | 105,209 | 83,724 | 39,868 | 39,734 | 39,546 | 29,652 | 28,057 | 27,675 | 27,613 | 26,357 | 26,054 | 25,863 | 0 | 0 |
| 29 | Long-term Investments and Receivables + | 20,812 | 17,314 | 15,732 | 112 | 0 | 0 | 51 | 0 | 0 | 0 | 0 | 0 | 0 | 0 | 0 |
| 30 | Long-Term Restricted Cash and Investments + | 276 | 271 | 230 | 190 | 0 | 0 | 0 | 0 | 0 | 0 | 0 | 0 | 0 | 0 | 0 |
| 31 | Current Liabilities + | 62,017 | 53,303 | 44,009 | 30,648 | 26,250 | 23,169 | 19,027 | 15,425 | 14,150 | 11,956 | 11,070 | 12,300 | 13,490 | 0 | 0 |
| 32 | Long-Term Other Undisclosed Liabilities | 11,888 | 11,895 | 0 | 0 | 0 | 0 | 0 | 0 | 0 | 0 | 0 | 0 | 0 | 0 | 0 |
| 33 | Long-Term Liabilities + | 98,997 | 104,976 | 82,170 | 26,760 | 27,164 | 27,809 | 13,226 | 14,262 | 10,634 | 10,653 | 9,710 | 9,858 | 9,194 | 0 | 0 |
| 34 | Increase (Decrease) in Stockholders' Equity [Roll Forward] + | -28,178 | -28,235 | -28,228 | -37,796 | -33,452 | -28,886 | -24,078 | -20,169 | -16,270 | -11,953 | -9,030 | -7,610 | -5,812 | 0 | 0 |
| 35 | Treasury Stock Transactions + | -28,178 | -28,235 | -28,228 | -37,796 | -33,452 | -28,886 | -24,078 | -20,169 | -16,270 | -11,953 | -9,030 | -7,610 | -5,812 | 0 | 0 |
| 36 | Treasury Stock + | -28,178 | -28,235 | -28,228 | -37,796 | -33,452 | -28,886 | -24,078 | -20,169 | -16,270 | -11,953 | -9,030 | -7,610 | -5,812 | 0 | 0 |
| 37 | Current Other Assets + | 5,277 | 5,113 | 4,581 | 945 | 660 | 722 | 866 | 472 | 577 | 580 | 144 | 140 | 202 | 0 | 0 |
| 38 | Total Current Assets + | 56,369 | 50,302 | 45,243 | 31,229 | 31,042 | 30,378 | 25,983 | 25,325 | 20,161 | 18,594 | 17,706 | 17,537 | 16,526 | 0 | 0 |
| 39 | Operating Lease + | 20,729 | 20,860 | 0 | 0 | 0 | 0 | 0 | 0 | 0 | 0 | 0 | 0 | 0 | 0 | 0 |
| 40 | Goodwill + | 79,552 | 79,749 | 78,678 | 38,451 | 38,249 | 38,106 | 28,142 | 26,542 | 26,395 | 26,458 | 25,669 | 25,680 | 25,494 | 0 | 0 |
| 41 | Long-Term Other Assets + | 4,624 | 4,600 | 5,046 | 1,417 | 1,485 | 1,440 | 1,510 | 1,515 | 1,280 | 1,155 | 688 | 374 | 369 | 0 | 0 |
| 42 | Total Assets + | 230,715 | 222,449 | 196,456 | 95,131 | 94,462 | 93,657 | 74,252 | 71,526 | 66,221 | 64,852 | 62,169 | 61,641 | 60,960 | 0 | 0 |
| 43 | Total Liabilities + | 161,014 | 158,279 | 137,913 | 57,436 | 0 | 0 | 0 | 0 | 0 | 0 | 0 | 0 | 0 | 0 | 0 |
| 44 | Stockholders' Equity Attributable to Noncontrolling Interest + | 312 | 306 | 318 | 4 | 4 | 7 | 5 | 0 | 0 | 0 | 0 | 0 | 0 | 0 | 0 |
| 45 | Total Stockholders' Equity + | 69,701 | 64,170 | 58,543 | 37,695 | 36,834 | 37,203 | 37,963 | 37,938 | 37,653 | 38,013 | 37,700 | 35,768 | 34,574 | 0 | 0 |
| 46 | Total Liabilities and Equity + | 230,715 | 222,449 | 196,456 | 95,131 | 94,462 | 93,657 | 74,252 | 71,526 | 66,221 | 64,543 | 62,169 | 61,641 | 60,960 | 0 | 0 |
Year | 2020 | 2019 | 2018 | 2017 | 2016 | 2015 | 2014 | 2013 | 2012 | 2011 | 2010 | 2009 | 2008 | 2007 | |
|---|---|---|---|---|---|---|---|---|---|---|---|---|---|---|---|
| 1 | 69,419 | 63,172 | 8,184 | 3,558 | 0 | 0 | 0 | 0 | 0 | 0 | 0 | 0 | 0 | 0 | |
| 2 | 268,706 | 256,776 | 194,579 | 184,786 | 177,526 | 153,290 | 139,367 | 126,761 | 123,120 | 107,080 | 95,778 | 98,215 | 87,472 | 76,330 | |
| 3 | -163,981 | -158,719 | -156,447 | -153,448 | -146,533 | 0 | 0 | 0 | 0 | 0 | 0 | 0 | 0 | 0 | |
| 4 | 55,679 | 52,529 | 6,594 | 2,810 | 2,179 | 0 | 0 | 0 | 0 | 0 | 0 | 0 | 0 | 0 | |
| 5 | 0 | 0 | 0 | -156,220 | -148,669 | -126,762 | -114,000 | -102,978 | -100,632 | -86,518 | -75,559 | -77,857 | -69,182 | -60,222 | |
| 6 | 0 | 0 | 0 | 28,545 | 28,857 | 26,528 | 25,367 | 23,783 | 22,488 | 20,562 | 20,219 | 20,358 | 18,290 | 16,108 | |
| 7 | 0 | 0 | 0 | 2,480 | 2,475 | 2,092 | 1,931 | 1,870 | 1,753 | 1,568 | 1,469 | 1,389 | 1,274 | 1,095 | |
| 8 | 0 | 0 | 0 | 187 | 0 | 0 | 0 | 0 | 0 | 0 | 0 | 0 | 0 | 0 | |
| 9 | 0 | 0 | 0 | 0 | 0 | 0 | 0 | -72 | 0 | 0 | 0 | 0 | 0 | 0 | |
| 10 | 332 | 480 | 492 | 65 | 0 | 0 | 0 | 0 | 0 | 0 | 0 | 0 | 0 | 0 | |
| 11 | 0 | 0 | 21,860 | 18,874 | 18,448 | 0 | 0 | 0 | 0 | 0 | 0 | 0 | 0 | 0 | |
| 12 | 0 | 111 | 256 | 177 | 221 | 0 | 0 | 0 | 0 | 0 | 0 | 0 | 0 | 0 | |
| 13 | 3 | 0 | 0 | 0 | 0 | 0 | 0 | 0 | 0 | 0 | 0 | 0 | 0 | 0 | |
| 14 | 272 | 205 | 86 | 9 | 0 | 0 | 0 | 0 | 0 | 0 | 0 | 0 | 0 | 0 | |
| 15 | 0 | -33,541 | -21,368 | -18,990 | -18,519 | -17,074 | -16,568 | -15,746 | -15,278 | -14,231 | -14,082 | -13,933 | -12,244 | -11,314 | |
| 16 | 13,911 | 11,987 | 4,021 | 9,538 | 10,338 | 9,454 | 8,799 | 8,037 | 7,210 | 6,331 | 6,137 | 6,425 | 6,046 | 4,794 | |
| 17 | 0 | 0 | 0 | 21 | 20 | 21 | 15 | 8 | 4 | 4 | 3 | 5 | 21 | 0 | |
| 18 | 781 | 854 | 660 | 0 | 0 | 0 | 0 | 0 | 0 | 0 | 0 | 0 | 0 | 0 | |
| 19 | -35 | -42 | -3 | 0 | 0 | 0 | 0 | 0 | 0 | 0 | 0 | 0 | 0 | 0 | |
| 20 | 798 | 1,011 | 660 | 0 | 0 | 0 | 0 | 0 | 0 | 0 | 0 | 0 | 0 | 0 | |
| 21 | 0 | 0 | 0 | -208 | -28 | -21 | 0 | 0 | 0 | 0 | 0 | 0 | 0 | 0 | |
| 22 | 206 | 124 | 4 | -208 | -28 | 0 | 0 | 0 | 0 | 0 | 0 | 0 | 0 | 0 | |
| 23 | 58 | 44 | 0 | 0 | 0 | 0 | 0 | 0 | 0 | 0 | 0 | 0 | 0 | 0 | |
| 24 | 2,907 | 3,035 | 2,619 | 1,062 | 1,078 | 859 | 615 | 517 | 561 | 588 | 539 | 530 | 530 | 0 | |
| 25 | -619 | 0 | 0 | 0 | 0 | 0 | 0 | 0 | 0 | 0 | 0 | 0 | 0 | 0 | |
| 26 | -664 | 0 | 0 | 0 | 0 | 0 | 0 | 0 | 0 | 0 | 0 | 0 | 0 | 0 | |
| 27 | 1,440 | 79 | 0 | 0 | 643 | 0 | 521 | 0 | 348 | 0 | 0 | 0 | 0 | 0 | |
| 28 | 9,770 | 8,997 | 1,406 | 8,268 | 8,637 | 8,616 | 7,678 | 7,528 | 6,305 | 5,747 | 5,601 | 5,900 | 5,537 | 4,359 | |
| 29 | 0 | 0 | 1,406 | 8,268 | 8,637 | 0 | 0 | 0 | 0 | 0 | 0 | 0 | 0 | 0 | |
| 30 | -2,569 | -2,366 | -2,002 | -1,637 | -3,317 | -3,386 | -3,033 | -2,928 | -2,436 | -2,258 | -2,179 | -2,200 | -2,193 | -1,722 | |
| 31 | 4,632 | 4,265 | -2,598 | 4,994 | 2,003 | 1,844 | 1,612 | 1,672 | 1,433 | 1,231 | 1,243 | 1,500 | 1,151 | 0 | |
| 32 | 0 | 0 | 0 | -13 | -2 | 15 | -1 | -12 | 0 | 0 | 0 | 0 | 0 | 0 | |
| 33 | 269 | -205 | -86 | 0 | 0 | 0 | 0 | 0 | 0 | 0 | 0 | 0 | 0 | 0 | |
| 34 | -12 | 0 | 0 | -13 | -2 | 0 | 0 | 0 | 0 | 0 | 24 | 19 | 214 | 0 | |
| 35 | -15 | 0 | 0 | -8 | -1 | -6 | 0 | 4 | 5 | -95 | 22 | 21 | 132 | 0 | |
| 36 | -9 | 0 | 0 | -8 | -1 | 9 | -1 | -8 | -7 | -31 | 2 | -4 | -132 | 0 | |
| 37 | 7,192 | 6,631 | -596 | 6,623 | 5,319 | 5,239 | 4,644 | 4,592 | 3,862 | 3,458 | 3,424 | 3,696 | 3,212 | 0 | |
| 38 | 0 | 0 | 0 | 0 | 1 | 1 | 0 | 0 | 0 | 0 | 0 | 0 | 0 | 0 | |
| 39 | -13 | 3 | 2 | -1 | -2 | -2 | 0 | 0 | 2 | 4 | 3 | 0 | 0 | 0 | |
| 40 | Total Net Income (Loss) Attributable to Parent + | 7,179 | 6,634 | -594 | 6,622 | 5,317 | 5,237 | 4,644 | 0 | 0 | 0 | 3,427 | 3,696 | 3,212 | 2,637 |
| 41 | 0 | 0 | 0 | 0 | 0 | 5,237 | 4,644 | 4,592 | 3,864 | 3,462 | 3,427 | 3,696 | 3,198 | 2,623 | |
| 42 | Income (Loss) from Continuing Operations + | 7,201 | 6,631 | -596 | 6,631 | 5,320 | 5,230 | 4,645 | 4,600 | 3,869 | 3,489 | 3,422 | 3,700 | 3,344 | 0 |
| 43 | Total Income (Loss) from Continuing Operations + | 14,389 | 13,260 | -1,193 | 13,237 | 10,611 | 10,432 | 9,271 | 9,200 | 7,740 | 6,982 | 6,847 | 7,400 | 6,688 | 2,637 |
| 44 | Income (Loss) from Discontinued Operations + | -9 | 0 | 0 | -8 | -1 | 9 | -1 | -8 | -7 | -31 | 2 | -4 | -132 | 0 |
| 45 | Income (Loss) from Continuing Operations + | 5.49 | 5.10 | -0.57 | 6.48 | 4.93 | 4.65 | 3.98 | 3.78 | 3.05 | 2.61 | 2.51 | 2.58 | 2.32 | 1.97 |
| 46 | -0.01 | 0 | 0 | -0.01 | 0 | 0 | 0 | 0 | 0 | 0 | 0 | 0 | 0 | 0 | |
| 47 | 0 | 0 | 0 | -0.02 | 0 | 0.01 | 0 | -0.01 | -0.01 | -0.02 | -0.01 | -0.01 | -0.09 | 0 | |
| 48 | Total Earnings Per Share + | 5.48 | 5.10 | -0.57 | 6.47 | 4.93 | 4.66 | 3.98 | 3.77 | 3.04 | 2.59 | 2.51 | 2.58 | 2.23 | 1.97 |
| 49 | Income (Loss) from Continuing Operations + | 5.49 | 5.10 | -0.57 | 6.48 | 4.93 | 4.65 | 3.98 | 3.78 | 3.05 | 2.61 | 2.51 | 2.58 | 2.32 | 1.97 |
| 50 | Income (Loss) from Continuing Operations + | 5.47 | 5.08 | -0.57 | 6.45 | 4.91 | 4.62 | 3.96 | 3.75 | 3.02 | 2.59 | 2.49 | 2.55 | 2.27 | 1.92 |
| 51 | -0.01 | 0 | 0 | -0.01 | 0 | 0 | 0 | 0 | 0 | 0 | 0 | 0 | 0 | 0 | |
| 52 | 0 | 0 | 0 | -0.02 | 0 | 0.01 | 0 | -0.01 | -0.01 | -0.02 | -0.01 | -0.01 | -0.09 | 0 | |
| 53 | Total Earnings Per Share + | 5.46 | 5.08 | -0.57 | 6.44 | 4.90 | 4.63 | 3.96 | 3.74 | 3.02 | 2.57 | 2.49 | 2.55 | 2.18 | 1.92 |
| 54 | 2 | 2 | 2 | 2 | 1.70 | 1.40 | 1.10 | 0.90 | 0.65 | 0.50 | 0.35 | 0.30 | 0.26 | 0.23 | |
| 55 | 0 | 0 | 4 | 4 | 0 | 0 | 0 | 0 | 0 | 0 | 0 | 0 | 0 | 0 | |
| 56 | -12 | 0 | 0 | -13 | -2 | 0 | 0 | 0 | 0 | 0 | 24 | 19 | 214 | 0 |
 Click to Enlarge