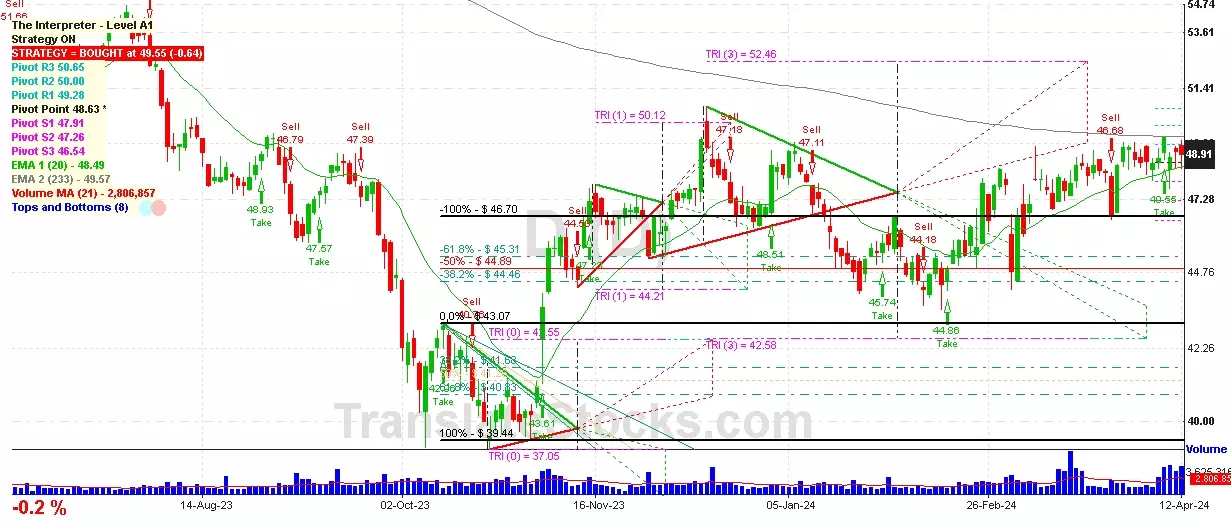
Hey Friend, I'm analysing DOMINION ENERGY INC (D), and it is between the Support of $ 48.63 (Pivot) and the Resistance of $ 49.28 (PivotR1). The stock is also approaching the line of Pivot at $ 48.63, and if it goes below this line it could reach the next Support of -100% of Fibonacci at $ 46.70.

| Date | Price $ | Result % | Candle Name | Side |
|---|---|---|---|---|
| 001 08 Apr 2024 | Buy Price: 48.78 | Profit: Open Day1 ($ 48.98) | Abandoned Baby | Buy |
| 002 30 Jan 2024 | Buy Price: 45.74 | Profit: Open Day1 ($ 46.05) | Engulfing | Buy |
| 003 14 Nov 2023 | Buy Price: 46.49 | Profit: Close Day1 ($ 47.23) | Abandoned Baby | Buy |
| 004 21 Jun 2023 | Buy Price: 53.29 | Profit: Open Day1 ($ 53.54) | Piercing Line | Buy |
| 005 27 Apr 2023 | Buy Price: 57.35 | Profit: Open Day1 ($ 57.37) | Engulfing | Buy |
| 006One Year Average | Both Sides Result for 5 Signals |
Profit: $ 1.52 ($ 0.30 / Signal) |
All of Them | Buy + Sell |
| Simple Moving Averages (SMA) Period | Value $ | Signal | Exponential Moving Averages (EMA) Period | Value $ | Signal | |
|---|---|---|---|---|---|---|
| 2 | 48.45 | BUY | 2 | 48.38 | BUY | |
| 3 | 47.92 | BUY | 3 | 48.28 | BUY | |
| 5 | 48.12 | BUY | 5 | 48.27 | BUY | |
| 8 | 48.49 | BUY | 8 | 48.34 | BUY | |
| 13 | 48.56 | BUY | 13 | 48.39 | BUY | |
| 21 | 48.48 | BUY | 21 | 48.30 | BUY | |
| 34 | 48.06 | BUY | 34 | 48.03 | BUY | |
| 55 | 47.21 | BUY | 55 | 47.64 | BUY | |
| 90 | 47.16 | BUY | 90 | 47.34 | BUY | |
| 200 | 47.09 | BUY | 200 | 48.73 | SELL |
Dominion Energy Inc
IPO: 1983-05-20
Ticker: DIndices: S&P 500,
Exchange: New York Stock Exchange, Inc. (US - USD)
Website: https://www.dominionenergy.com/
Phone:
Common Stock
Energy & Transportation (
Electric Services
 Click to Enlarge