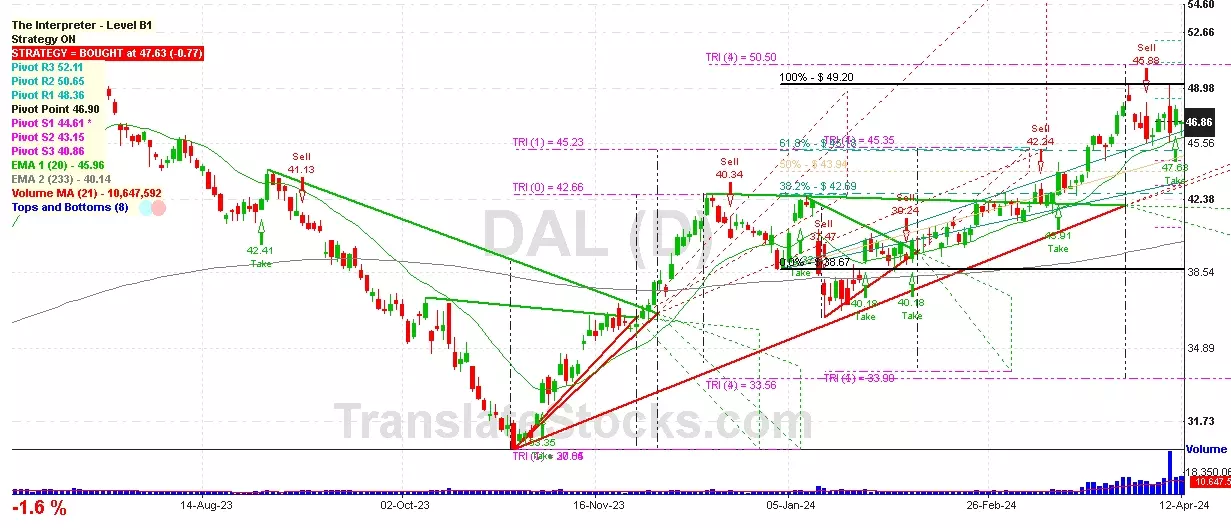
Hey Friend, I'm analysing DELTA AIR LINES INC (DAL), and it is between the Support of $ 45.35 (Triangle Projection Level 1) and the Resistance of $ 46.90 (Pivot). The stock is also approaching the line of Pivot at $ 46.90, and if it goes above this line it could reach the next Resistance of 100% of Fibonacci at $ 49.20.

| Date | Price $ | Result % | Candle Name | Side |
|---|---|---|---|---|
| 001 19 Jan 2024 | Sell Price: 37.28 | Profit: Close Day1 ($ 36.98) | Engulfing | Sell |
| 002 02 Jan 2024 | Buy Price: 40.45 | Loss: Close Day2 ($ 39.21) | Piercing Line | Buy |
| 003 28 Dec 2023 | Buy Price: 40.64 | Loss: Close Day2 ($ 40.44) | Piercing Line | Buy |
| 004 12 Jul 2023 | Sell Price: 47.95 | Profit: Close Day1 ($ 47.71) | Engulfing | Sell |
| 005One Year Average | Both Sides Result for 4 Signals |
Loss: $ -0.90 ($ -0.23 / Signal) |
All of Them | Buy + Sell |
| Simple Moving Averages (SMA) Period | Value $ | Signal | Exponential Moving Averages (EMA) Period | Value $ | Signal | |
|---|---|---|---|---|---|---|
| 2 | 48.59 | SELL | 2 | 48.29 | SELL | |
| 3 | 48.73 | SELL | 3 | 48.35 | SELL | |
| 5 | 48.32 | SELL | 5 | 48.24 | SELL | |
| 8 | 47.84 | BUY | 8 | 47.99 | SELL | |
| 13 | 47.52 | BUY | 13 | 47.61 | BUY | |
| 21 | 47.26 | BUY | 21 | 47.00 | BUY | |
| 34 | 45.96 | BUY | 34 | 46.02 | BUY | |
| 55 | 44.13 | BUY | 55 | 44.70 | BUY | |
| 90 | 42.51 | BUY | 90 | 43.19 | BUY | |
| 200 | 40.77 | BUY | 200 | 41.02 | BUY |
Delta Air Lines Inc
IPO: 2007-04-26
Ticker: DALIndices: S&P 500,
Exchange: New York Stock Exchange, Inc. (US - USD)
Website: https://www.delta.com/
Phone:
Common Stock
Energy & Transportation (
Air Transportation, Scheduled
 Click to Enlarge