
| Date | Price $ | Result % | Candle Name | Side |
|---|---|---|---|---|
| 001 12 Feb 2024 | Buy Price: 389.39 | Loss: Close Day2 ($ 384.78) | Abandoned Baby | Buy |
| 002 13 Dec 2023 | Buy Price: 377.01 | Profit: Open Day1 ($ 381.24) | Engulfing | Buy |
| 003 25 Sep 2023 | Buy Price: 384.39 | Loss: Close Day2 ($ 384.36) | Engulfing | Buy |
| 004 18 Sep 2023 | Sell Price: 410.84 | Profit: Open Day1 ($ 402.59) | Abandoned Baby | Sell |
| 005 23 Aug 2023 | Buy Price: 394.28 | Loss: Close Day2 ($ 390.21) | Engulfing | Buy |
| 006 28 Apr 2023 | Buy Price: 378.02 | Profit: Open Day1 ($ 379.95) | Engulfing | Buy |
| 007One Year Average | Both Sides Result for 6 Signals |
Profit: $ 5.70 ($ 0.95 / Signal) |
All of Them | Buy + Sell |
| Simple Moving Averages (SMA) Period | Value $ | Signal | Exponential Moving Averages (EMA) Period | Value $ | Signal | |
|---|---|---|---|---|---|---|
| 2 | 398.74 | BUY | 2 | 399.06 | BUY | |
| 3 | 396.83 | BUY | 3 | 398.55 | BUY | |
| 5 | 396.31 | BUY | 5 | 399.16 | BUY | |
| 8 | 402.23 | SELL | 8 | 400.52 | BUY | |
| 13 | 404.48 | SELL | 13 | 401.07 | SELL | |
| 21 | 403.30 | SELL | 21 | 399.22 | BUY | |
| 34 | 392.69 | BUY | 34 | 395.43 | BUY | |
| 55 | 385.96 | BUY | 55 | 391.52 | BUY | |
| 90 | 387.04 | BUY | 90 | 388.91 | BUY | |
| 200 | 391.85 | BUY | 200 | 388.69 | BUY |
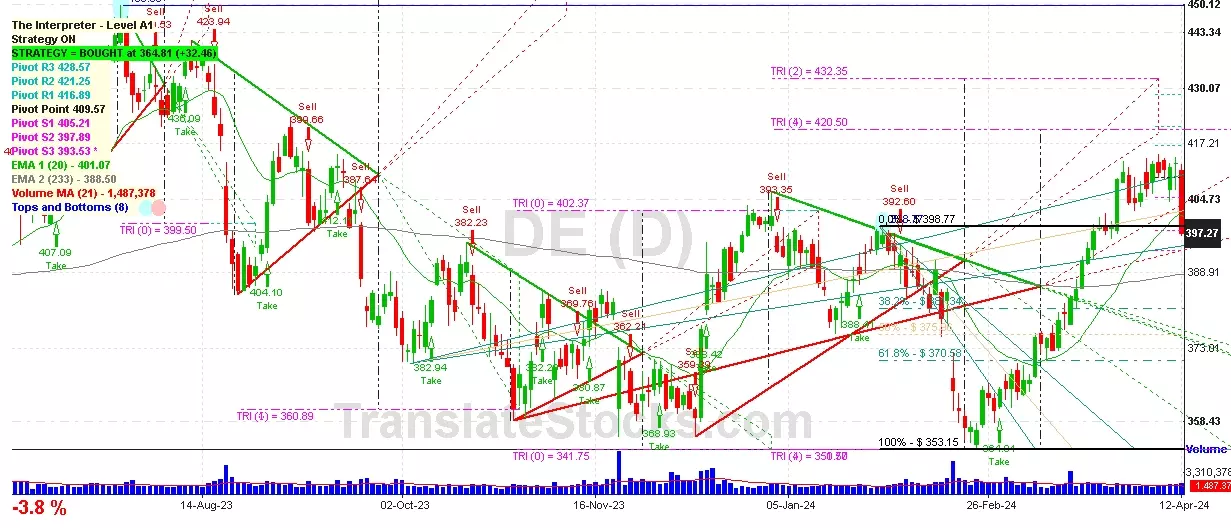
Deere & Co
IPO: 1933-06-29
Ticker: DEIndices: S&P 500,
Exchange: New York Stock Exchange, Inc. (US - USD)
Website: https://www.deere.com/
Phone:
Common Stock
Technology (
Farm Machinery & Equipment

 Click to Enlarge