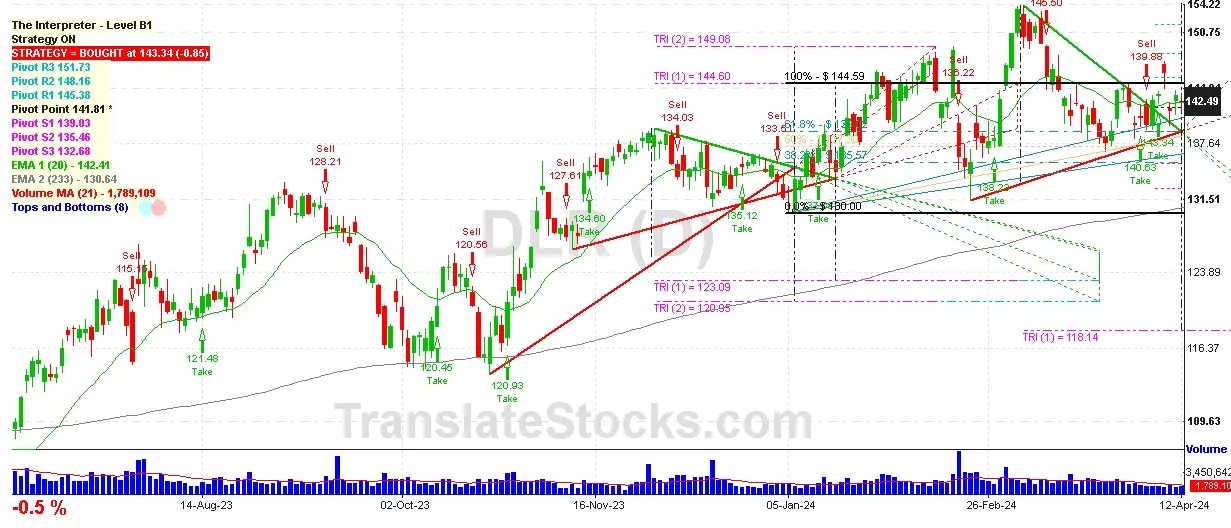
Hey Friend, I'm analysing DIGITAL REALTY TRUST INC (DLR), and it is between the Support of $ 141.81 (Pivot) and the Resistance of $ 144.59 (100% of Fibonacci). The stock is also approaching the line of Pivot at $ 141.81, and if it goes below this line it could reach the next Support of 61.8% of Fibonacci at $ 139.02.

| Date | Price $ | Result % | Candle Name | Side |
|---|---|---|---|---|
| 001 19 Mar 2024 | Sell Price: 141.74 | Profit: Open Day1 ($ 139.80) | Abandoned Baby | Sell |
| 002 18 Mar 2024 | Buy Price: 142.21 | Loss: Close Day2 ($ 140.90) | Abandoned Baby | Buy |
| 003 21 Feb 2024 | Buy Price: 135.53 | Profit: Open Day1 ($ 140.00) | Piercing Line | Buy |
| 004 16 Feb 2024 | Sell Price: 136.22 | Profit: Open Day1 ($ 136.01) | Abandoned Baby | Sell |
| 005 08 Jan 2024 | Buy Price: 133.70 | Profit: Open Day2 ($ 134.00) | Engulfing | Buy |
| 006 02 Jan 2024 | Buy Price: 135.23 | Loss: Close Day2 ($ 131.79) | Engulfing | Buy |
| 007 18 Dec 2023 | Buy Price: 132.32 | Profit: Open Day1 ($ 133.00) | Abandoned Baby | Buy |
| 008 24 Nov 2023 | Sell Price: 136.50 | Loss: Close Day2 ($ 136.90) | Abandoned Baby | Sell |
| 009 14 Nov 2023 | Buy Price: 134.30 | Profit: Close Day1 ($ 134.60) | Abandoned Baby | Buy |
| 010 06 Nov 2023 | Sell Price: 129.49 | Profit: Close Day1 ($ 127.98) | Abandoned Baby | Sell |
| 011 13 Oct 2023 | Sell Price: 122.60 | Profit: Open Day2 ($ 122.52) | Engulfing | Sell |
| 012 05 Sep 2023 | Sell Price: 130.70 | Profit: Open Day1 ($ 129.95) | Abandoned Baby | Sell |
| 013 14 Jul 2023 | Sell Price: 118.28 | Profit: Open Day1 ($ 118.00) | Abandoned Baby | Sell |
| 014One Year Average | Both Sides Result for 13 Signals |
Profit: $ 5.37 ($ 0.41 / Signal) |
All of Them | Buy + Sell |
| Simple Moving Averages (SMA) Period | Value $ | Signal | Exponential Moving Averages (EMA) Period | Value $ | Signal | |
|---|---|---|---|---|---|---|
| 2 | 139.57 | BUY | 2 | 139.67 | BUY | |
| 3 | 138.33 | BUY | 3 | 139.05 | BUY | |
| 5 | 137.70 | BUY | 5 | 138.53 | BUY | |
| 8 | 137.40 | BUY | 8 | 138.58 | BUY | |
| 13 | 139.66 | BUY | 13 | 139.08 | BUY | |
| 21 | 140.34 | BUY | 21 | 139.84 | BUY | |
| 34 | 141.43 | SELL | 34 | 140.54 | BUY | |
| 55 | 142.23 | SELL | 55 | 140.53 | BUY | |
| 90 | 140.20 | BUY | 90 | 138.99 | BUY | |
| 200 | 132.21 | BUY | 200 | 132.41 | BUY |
Digital Realty Trust Inc
IPO: 2004-10-29
Ticker: DLRIndices: S&P 500,
Exchange: New York Stock Exchange, Inc. (US - USD)
Website: https://www.digitalrealty.com
Phone:
REIT (Real Estate Investment Trust)
Real Estate & Construction (
Real Estate Investment Trusts
 Click to Enlarge