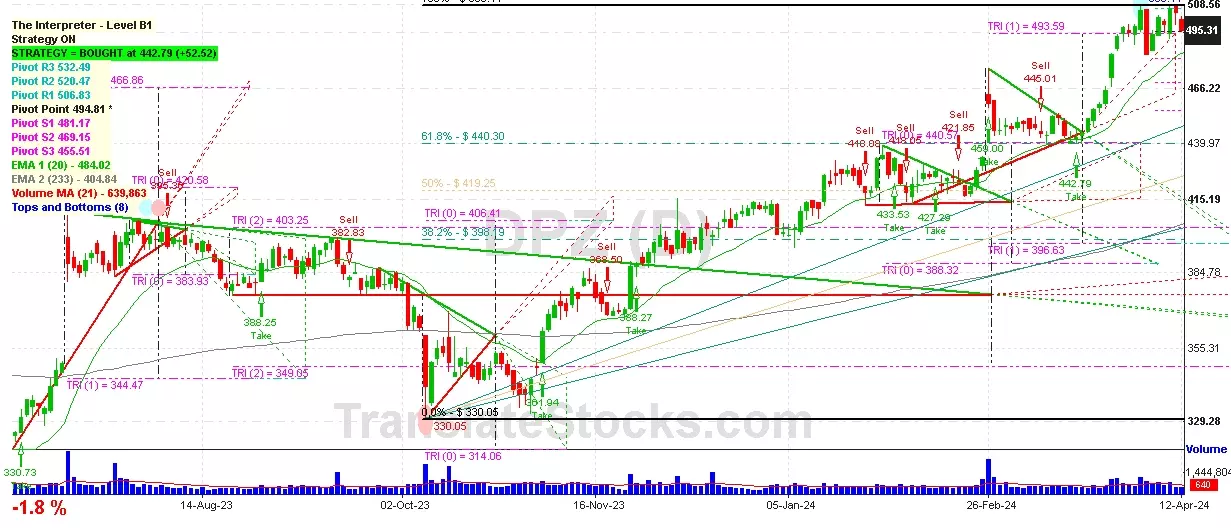
Hey Friend, I'm analysing DOMINO'S PIZZA INC (DPZ), and it is between the Support of $ 494.81 (Pivot) and the Resistance of $ 506.83 (PivotR1). The stock is also approaching the line of Pivot at $ 494.81, and if it goes below this line it could reach the next Support of Triangle projection at $493.59.

| Date | Price $ | Result % | Candle Name | Side |
|---|---|---|---|---|
| 001 04 Apr 2024 | Sell Price: 482.86 | Loss: Close Day2 ($ 501.98) | Engulfing | Sell |
| 002 06 Feb 2024 | Buy Price: 421.58 | Profit: Open Day1 ($ 421.63) | Engulfing | Buy |
| 003 08 Jan 2024 | Buy Price: 402.69 | Profit: Close Day1 ($ 410.14) | Abandoned Baby | Buy |
| 004 15 Dec 2023 | Sell Price: 400.05 | Loss: Close Day2 ($ 406.56) | Abandoned Baby | Sell |
| 005 26 Sep 2023 | Sell Price: 378.80 | Loss: Close Day2 ($ 382.31) | Engulfing | Sell |
| 006 26 Sep 2023 | Sell Price: 379.22 | Loss: Close Day2 ($ 382.31) | Dark Cloud Cover | Sell |
| 007 20 Sep 2023 | Buy Price: 384.84 | Loss: Close Day2 ($ 381.35) | Abandoned Baby | Buy |
| 008 24 Aug 2023 | Sell Price: 378.86 | Loss: Close Day2 ($ 388.41) | Abandoned Baby | Sell |
| 009 21 Aug 2023 | Buy Price: 379.88 | Profit: Open Day2 ($ 380.62) | Piercing Line | Buy |
| 010 28 Jul 2023 | Sell Price: 400.88 | Profit: Open Day1 ($ 400.23) | Dark Cloud Cover | Sell |
| 011 26 Jun 2023 | Buy Price: 319.24 | Profit: Open Day1 ($ 320.00) | Piercing Line | Buy |
| 012 01 Jun 2023 | Buy Price: 296.67 | Profit: Open Day1 ($ 298.28) | Abandoned Baby | Buy |
| 013One Year Average | Both Sides Result for 12 Signals |
Loss: $ -34.01 ($ -2.83 / Signal) |
All of Them | Buy + Sell |
| Simple Moving Averages (SMA) Period | Value $ | Signal | Exponential Moving Averages (EMA) Period | Value $ | Signal | |
|---|---|---|---|---|---|---|
| 2 | 477.61 | SELL | 2 | 476.53 | SELL | |
| 3 | 479.09 | SELL | 3 | 478.72 | SELL | |
| 5 | 482.39 | SELL | 5 | 482.25 | SELL | |
| 8 | 489.82 | SELL | 8 | 485.39 | SELL | |
| 13 | 492.38 | SELL | 13 | 486.20 | SELL | |
| 21 | 487.79 | SELL | 21 | 482.51 | SELL | |
| 34 | 472.23 | BUY | 34 | 473.96 | SELL | |
| 55 | 456.21 | BUY | 55 | 461.14 | BUY | |
| 90 | 439.38 | BUY | 90 | 444.22 | BUY | |
| 200 | 405.33 | BUY | 200 | 412.73 | BUY |
Domino's Pizza Inc
IPO: 2004-07-13
Ticker: DPZIndices: S&P 500,
Exchange: New York Stock Exchange, Inc. (US - USD)
Website: https://www.dominos.com/
Phone:
Common Stock
Trade & Services (
Wholesale-groceries & Related Products
 Click to Enlarge