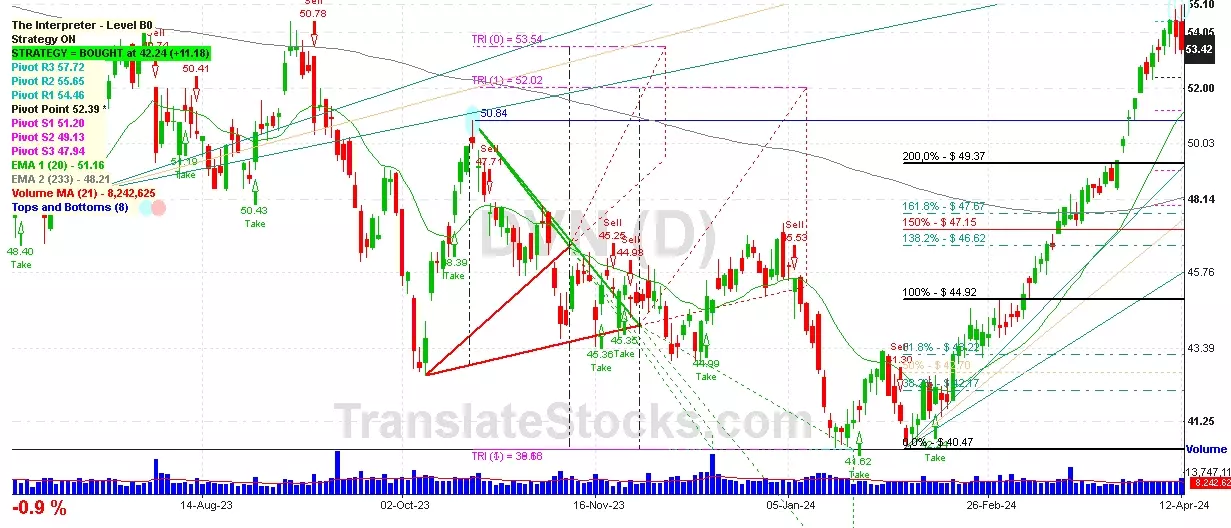
Hey Friend, I'm analysing DEVON ENERGY CORP (DVN), and it is between the Support of $ 52.39 (Pivot) and the Resistance of $ 53.54 (Triangle Projection Level 0). The stock is also approaching the line of Pivot at $ 52.39, and if it goes below this line it could reach the next Support of Triangle projection at $52.02.

| Date | Price $ | Result % | Candle Name | Side |
|---|---|---|---|---|
| 001 19 Mar 2024 | Buy Price: 48.43 | Profit: Close Day1 ($ 48.61) | Engulfing | Buy |
| 002 28 Feb 2024 | Sell Price: 44.03 | Loss: Close Day2 ($ 44.39) | Abandoned Baby | Sell |
| 003 13 Dec 2023 | Buy Price: 44.22 | Profit: Open Day1 ($ 44.25) | Engulfing | Buy |
| 004 09 Aug 2023 | Buy Price: 51.19 | Profit: Open Day1 ($ 51.32) | Abandoned Baby | Buy |
| 005 23 May 2023 | Sell Price: 49.11 | Profit: Open Day2 ($ 48.68) | Engulfing | Sell |
| 006 23 May 2023 | Sell Price: 49.19 | Profit: Open Day2 ($ 48.68) | Dark Cloud Cover | Sell |
| 007One Year Average | Both Sides Result for 6 Signals |
Profit: $ 0.92 ($ 0.15 / Signal) |
All of Them | Buy + Sell |
| Simple Moving Averages (SMA) Period | Value $ | Signal | Exponential Moving Averages (EMA) Period | Value $ | Signal | |
|---|---|---|---|---|---|---|
| 2 | 52.34 | SELL | 2 | 52.19 | SELL | |
| 3 | 52.27 | SELL | 3 | 52.19 | SELL | |
| 5 | 52.01 | BUY | 5 | 52.19 | SELL | |
| 8 | 52.07 | BUY | 8 | 52.25 | SELL | |
| 13 | 52.77 | SELL | 13 | 52.15 | SELL | |
| 21 | 52.17 | SELL | 21 | 51.58 | BUY | |
| 34 | 50.42 | BUY | 34 | 50.43 | BUY | |
| 55 | 47.71 | BUY | 55 | 49.00 | BUY | |
| 90 | 46.19 | BUY | 90 | 47.88 | BUY | |
| 200 | 47.34 | BUY | 200 | 48.17 | BUY |
Devon Energy Corp
IPO: 2004-10-12
Ticker: DVNIndices: S&P 500,
Exchange: New York Stock Exchange, Inc. (US - USD)
Website: http://www.devonenergy.com
Phone:
Common Stock
Energy & Transportation (
Crude Petroleum & Natural Gas
 Click to Enlarge