| Date | Price $ | Result % | Candle Name | Side |
|---|---|---|---|---|
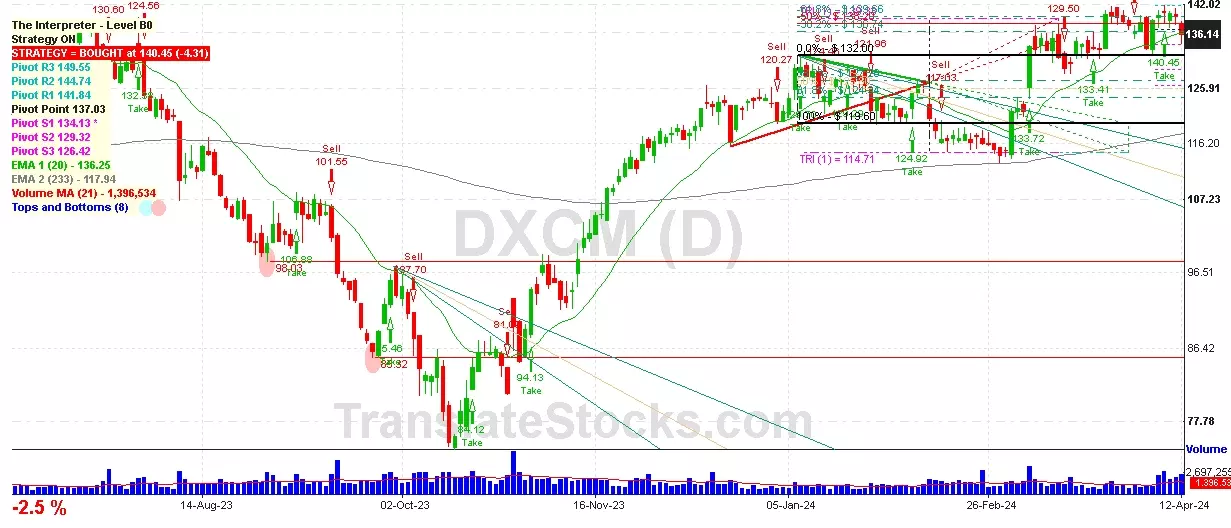
| 001 10 Apr 2024 | Sell Price: 140.32 | Profit: Open Day1 ($ 140.10) | Abandoned Baby | Sell |
| 002 13 Mar 2024 | Sell Price: 131.68 | Profit: Close Day1 ($ 129.50) | Engulfing | Sell |
| 003 05 Mar 2024 | Sell Price: 121.66 | Loss: Close Day2 ($ 133.24) | Engulfing | Sell |
| 004 05 Mar 2024 | Sell Price: 121.78 | Loss: Close Day2 ($ 133.24) | Dark Cloud Cover | Sell |
| 005 29 Dec 2023 | Sell Price: 124.09 | Profit: Open Day1 ($ 123.15) | Abandoned Baby | Sell |
| 006 18 Dec 2023 | Buy Price: 123.35 | Profit: Open Day1 ($ 123.63) | Engulfing | Buy |
| 007 31 Aug 2023 | Sell Price: 100.98 | Profit: Close Day2 ($ 100.33) | Engulfing | Sell |
| 008 27 Apr 2023 | Sell Price: 123.58 | Profit: Open Day1 ($ 119.26) | Dark Cloud Cover | Sell |
| 009One Year Average | Both Sides Result for 8 Signals |
Loss: $ -14.45 ($ -1.81 / Signal) |
All of Them | Buy + Sell |
| Simple Moving Averages (SMA) Period | Value $ | Signal | Exponential Moving Averages (EMA) Period | Value $ | Signal | |
|---|---|---|---|---|---|---|
| 2 | 135.94 | BUY | 2 | 136.32 | BUY | |
| 3 | 134.46 | BUY | 3 | 135.46 | BUY | |
| 5 | 133.68 | BUY | 5 | 134.87 | BUY | |
| 8 | 134.17 | BUY | 8 | 134.92 | BUY | |
| 13 | 136.14 | BUY | 13 | 135.25 | BUY | |
| 21 | 136.82 | BUY | 21 | 135.06 | BUY | |
| 34 | 135.59 | BUY | 34 | 133.70 | BUY | |
| 55 | 129.53 | BUY | 55 | 130.99 | BUY | |
| 90 | 127.47 | BUY | 90 | 126.91 | BUY | |
| 200 | 115.10 | BUY | 200 | 122.94 | BUY |
Dexcom Inc
IPO: 2005-04-14
Ticker: DXCMIndices: S&P 500,
Nasdaq 100,
Exchange: Nasdaq Nms - Global Market (US - USD)
Website: https://www.dexcom.com/
Phone:
Common Stock
Life Sciences (
Surgical & Medical Instruments & Apparatus

 Click to Enlarge