| Date | Price $ | Result % | Candle Name | Side |
|---|---|---|---|---|
| 001 16 Feb 2024 | Sell Price: 142.28 | Profit: Open Day1 ($ 141.77) | Engulfing | Sell |
| 002 06 Dec 2023 | Sell Price: 137.14 | Profit: Close Day1 ($ 135.55) | Dark Cloud Cover | Sell |
| 003 20 Sep 2023 | Sell Price: 120.45 | Profit: Open Day1 ($ 120.10) | Dark Cloud Cover | Sell |
| 004 19 Sep 2023 | Buy Price: 121.00 | Profit: Open Day1 ($ 121.48) | Piercing Line | Buy |
| 005 24 Aug 2023 | Sell Price: 119.91 | Profit: Close Day1 ($ 119.69) | Engulfing | Sell |
| 006 24 Aug 2023 | Sell Price: 119.99 | Profit: Open Day1 ($ 119.93) | Dark Cloud Cover | Sell |
| 007 06 Jun 2023 | Buy Price: 127.14 | Loss: Close Day2 ($ 127.11) | Abandoned Baby | Buy |
| 008 19 May 2023 | Sell Price: 125.66 | Profit: Close Day1 ($ 125.12) | Dark Cloud Cover | Sell |
| 009 27 Apr 2023 | Buy Price: 126.51 | Profit: Close Day1 ($ 127.28) | Engulfing | Buy |
| 010 27 Apr 2023 | Buy Price: 126.44 | Profit: Close Day1 ($ 127.28) | Piercing Line | Buy |
| 011One Year Average | Both Sides Result for 10 Signals |
Profit: $ 5.33 ($ 0.53 / Signal) |
All of Them | Buy + Sell |
| Simple Moving Averages (SMA) Period | Value $ | Signal | Exponential Moving Averages (EMA) Period | Value $ | Signal | |
|---|---|---|---|---|---|---|
| 2 | 126.43 | SELL | 2 | 126.49 | SELL | |
| 3 | 126.64 | SELL | 3 | 126.76 | SELL | |
| 5 | 127.40 | SELL | 5 | 127.34 | SELL | |
| 8 | 128.37 | SELL | 8 | 128.09 | SELL | |
| 13 | 129.60 | SELL | 13 | 129.11 | SELL | |
| 21 | 130.49 | SELL | 21 | 130.45 | SELL | |
| 34 | 132.74 | SELL | 34 | 132.08 | SELL | |
| 55 | 135.38 | SELL | 55 | 133.46 | SELL | |
| 90 | 136.30 | SELL | 90 | 133.88 | SELL | |
| 200 | 131.56 | SELL | 200 | 132.07 | SELL |
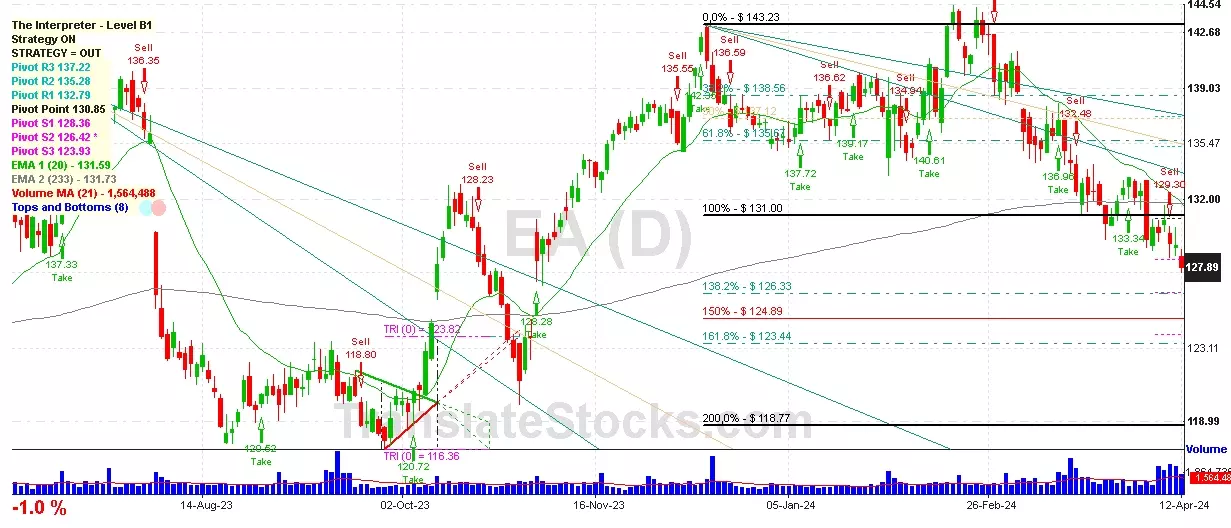
Electronic Arts Inc
IPO: 1989-01-09
Ticker: EAIndices: S&P 500,
Nasdaq 100,
Exchange: Nasdaq Nms - Global Market (US - USD)
Website: https://www.ea.com/
Phone:
Common Stock
Technology (
Services-prepackaged Software

 Click to Enlarge