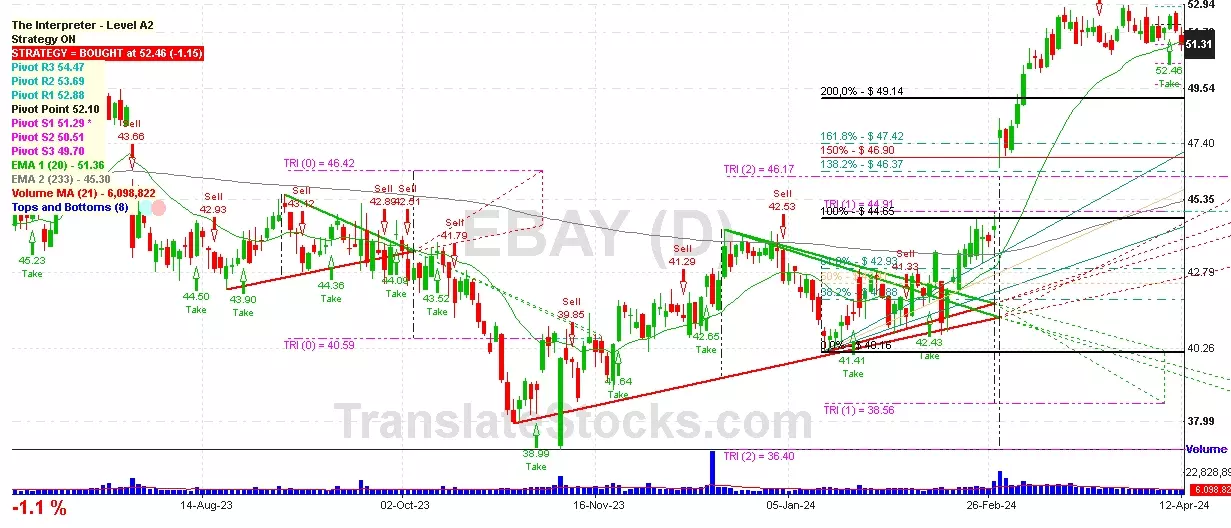
Hey Friend, I'm analysing EBAY INC (EBAY), and it is between the Support of $ 51.29 (PivotS1) and the Resistance of $ 52.10 (Pivot). The stock is also approaching the line of PivotS1 at $ 51.29, and if it goes below this line it could reach the next Support of 200% of Fibonacci at $ 49.14.

| Date | Price $ | Result % | Candle Name | Side |
|---|---|---|---|---|
| 001 22 Mar 2024 | Sell Price: 51.42 | Profit: Open Day1 ($ 51.33) | Engulfing | Sell |
| 002 29 Feb 2024 | Sell Price: 47.28 | Profit: Open Day1 ($ 47.20) | Engulfing | Sell |
| 003 22 Jan 2024 | Sell Price: 40.99 | Loss: Close Day2 ($ 41.61) | Engulfing | Sell |
| 004 22 Jan 2024 | Sell Price: 41.06 | Loss: Close Day2 ($ 41.61) | Dark Cloud Cover | Sell |
| 005 30 Oct 2023 | Buy Price: 38.64 | Profit: Open Day1 ($ 38.69) | Abandoned Baby | Buy |
| 006 06 Oct 2023 | Buy Price: 43.02 | Profit: Close Day1 ($ 43.35) | Engulfing | Buy |
| 007 06 Oct 2023 | Buy Price: 43.01 | Profit: Close Day1 ($ 43.35) | Piercing Line | Buy |
| 008 28 Sep 2023 | Buy Price: 43.65 | Profit: Open Day1 ($ 44.09) | Engulfing | Buy |
| 009 18 Sep 2023 | Sell Price: 43.91 | Profit: Open Day1 ($ 43.63) | Abandoned Baby | Sell |
| 010 05 Sep 2023 | Sell Price: 44.29 | Profit: Open Day1 ($ 44.17) | Abandoned Baby | Sell |
| 011 02 Aug 2023 | Buy Price: 43.76 | Loss: Close Day2 ($ 43.05) | Piercing Line | Buy |
| 012 07 Jul 2023 | Buy Price: 44.26 | Profit: Close Day1 ($ 45.67) | Piercing Line | Buy |
| 013One Year Average | Both Sides Result for 12 Signals |
Profit: $ 1.27 ($ 0.11 / Signal) |
All of Them | Buy + Sell |
| Simple Moving Averages (SMA) Period | Value $ | Signal | Exponential Moving Averages (EMA) Period | Value $ | Signal | |
|---|---|---|---|---|---|---|
| 2 | 50.17 | BUY | 2 | 50.23 | BUY | |
| 3 | 49.93 | BUY | 3 | 50.21 | BUY | |
| 5 | 50.19 | BUY | 5 | 50.35 | BUY | |
| 8 | 50.82 | SELL | 8 | 50.62 | SELL | |
| 13 | 51.19 | SELL | 13 | 50.88 | SELL | |
| 21 | 51.43 | SELL | 21 | 50.86 | SELL | |
| 34 | 51.33 | SELL | 34 | 50.20 | BUY | |
| 55 | 48.36 | BUY | 55 | 48.89 | BUY | |
| 90 | 46.01 | BUY | 90 | 47.29 | BUY | |
| 200 | 44.34 | BUY | 200 | 45.50 | BUY |
Ebay Inc
IPO: 1998-09-23
Ticker: EBAYIndices: S&P 500,
Nasdaq 100,
Exchange: Nasdaq Nms - Global Market (US - USD)
Website: https://www.ebayinc.com/
Phone:
Common Stock
Trade & Services (
Services-business Services, Nec
 Click to Enlarge