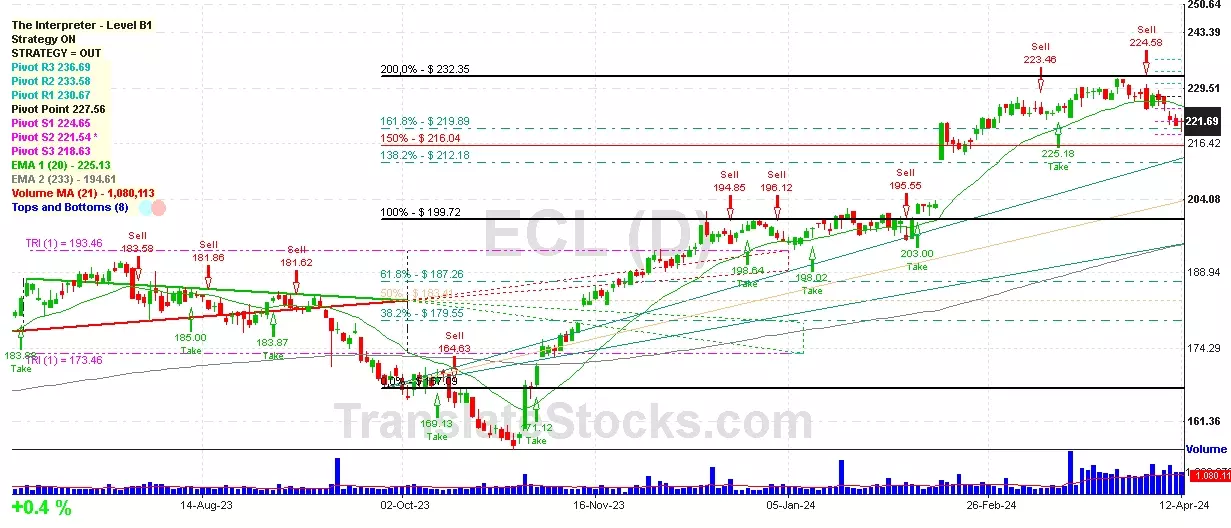
Hey Friend, I'm analysing ECOLAB INC (ECL), and it is between the Support of $ 221.54 (PivotS2) and the Resistance of $ 224.65 (PivotS1). The stock is also approaching the line of PivotS2 at $ 221.54, and if it goes below this line it could reach the next Support of 161.8% of Fibonacci at $ 219.89.

| Date | Price $ | Result % | Candle Name | Side |
|---|---|---|---|---|
| 001 25 Mar 2024 | Sell Price: 227.07 | Profit: Open Day1 ($ 226.93) | Engulfing | Sell |
| 002 31 Jan 2024 | Sell Price: 198.22 | Profit: Open Day1 ($ 197.82) | Engulfing | Sell |
| 003 20 Dec 2023 | Sell Price: 194.85 | Loss: Close Day2 ($ 197.59) | Abandoned Baby | Sell |
| 004 13 Jul 2023 | Sell Price: 186.33 | Profit: Open Day1 ($ 186.15) | Engulfing | Sell |
| 005One Year Average | Both Sides Result for 4 Signals |
Loss: $ -2.02 ($ -0.51 / Signal) |
All of Them | Buy + Sell |
| Simple Moving Averages (SMA) Period | Value $ | Signal | Exponential Moving Averages (EMA) Period | Value $ | Signal | |
|---|---|---|---|---|---|---|
| 2 | 219.49 | BUY | 2 | 219.46 | BUY | |
| 3 | 219.04 | BUY | 3 | 219.37 | BUY | |
| 5 | 219.12 | BUY | 5 | 219.50 | BUY | |
| 8 | 219.59 | BUY | 8 | 220.10 | SELL | |
| 13 | 221.53 | SELL | 13 | 221.23 | SELL | |
| 21 | 224.10 | SELL | 21 | 222.24 | SELL | |
| 34 | 224.82 | SELL | 34 | 221.84 | SELL | |
| 55 | 221.15 | SELL | 55 | 218.78 | BUY | |
| 90 | 212.15 | BUY | 90 | 212.58 | BUY | |
| 200 | 193.87 | BUY | 200 | 198.56 | BUY |
Ecolab Inc
IPO: 1957-01-01
Ticker: ECLIndices: S&P 500,
Exchange: New York Stock Exchange, Inc. (US - USD)
Website: https://www.ecolab.com/
Phone:
Common Stock
Life Sciences (
Soap, Detergents, Cleang Preparations, Perfumes, Cosmetics
 Click to Enlarge