| Date | Price $ | Result % | Candle Name | Side |
|---|---|---|---|---|
| 001 23 Jan 2024 | Sell Price: 95.78 | Profit: Close Day1 ($ 94.39) | Dark Cloud Cover | Sell |
| 002 28 Dec 2023 | Sell Price: 97.09 | Profit: Open Day1 ($ 96.93) | Engulfing | Sell |
| 003 17 Aug 2023 | Sell Price: 95.73 | Profit: Open Day1 ($ 95.05) | Dark Cloud Cover | Sell |
| 004 12 Jun 2023 | Sell Price: 84.07 | Loss: Close Day2 ($ 85.84) | Abandoned Baby | Sell |
| 005 01 Jun 2023 | Buy Price: 79.35 | Profit: Open Day1 ($ 80.80) | Abandoned Baby | Buy |
| 006 08 May 2023 | Sell Price: 83.81 | Profit: Open Day1 ($ 83.45) | Engulfing | Sell |
| 007 02 May 2023 | Sell Price: 82.22 | Loss: Close Day2 ($ 82.74) | Abandoned Baby | Sell |
| 008One Year Average | Both Sides Result for 7 Signals |
Profit: $ 1.75 ($ 0.25 / Signal) |
All of Them | Buy + Sell |
| Simple Moving Averages (SMA) Period | Value $ | Signal | Exponential Moving Averages (EMA) Period | Value $ | Signal | |
|---|---|---|---|---|---|---|
| 2 | 109.70 | SELL | 2 | 109.56 | BUY | |
| 3 | 109.34 | BUY | 3 | 109.50 | BUY | |
| 5 | 109.18 | BUY | 5 | 109.64 | SELL | |
| 8 | 109.87 | SELL | 8 | 110.09 | SELL | |
| 13 | 111.40 | SELL | 13 | 110.69 | SELL | |
| 21 | 112.14 | SELL | 21 | 110.97 | SELL | |
| 34 | 111.71 | SELL | 34 | 110.31 | SELL | |
| 55 | 109.29 | BUY | 55 | 108.31 | BUY | |
| 90 | 103.80 | BUY | 90 | 105.18 | BUY | |
| 200 | 98.02 | BUY | 200 | 99.41 | BUY |
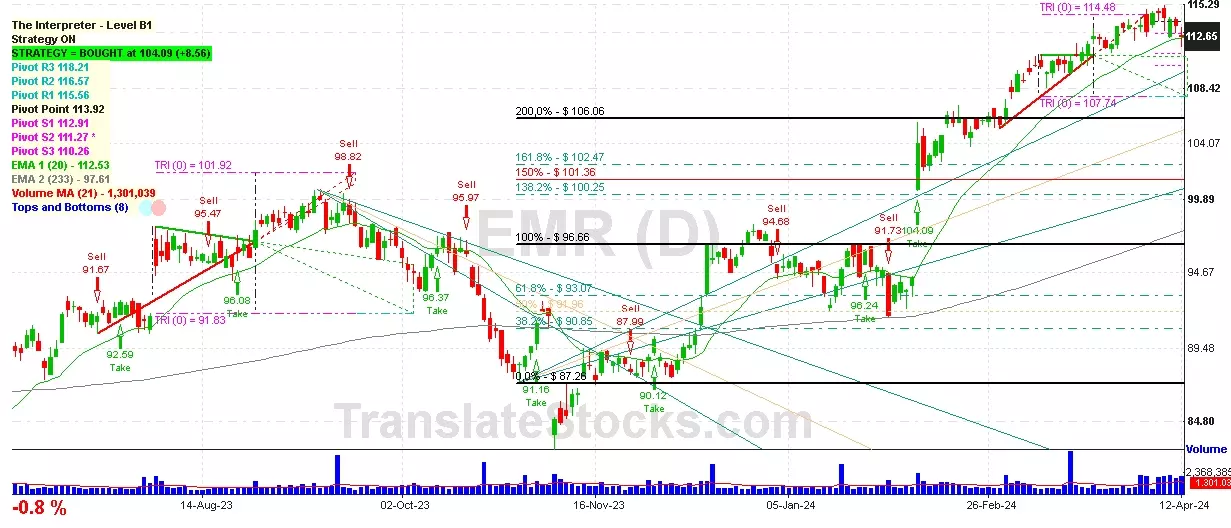
Emerson Electric Co
IPO: 1944-09-05
Ticker: EMRIndices: S&P 500,
Exchange: New York Stock Exchange, Inc. (US - USD)
Website: https://www.emerson.com/en-us
Phone:
Common Stock
Manufacturing (
Electronic & Other Electrical Equipment (no Computer Equip)

 Click to Enlarge